Quantcast
Channel: Intel Developer Zone Articles
Viewing all 533 articles
Browse latest View live

Virtual Archers Put Gesture to the Test with Longbow*

$
0
0

By John Tyrrell

Initially released in 2013 for mobile devices, developer Jason Allen reworked archery mini-game Longbow* for Intel® RealSense™ technology-enabled laptops, PCs, and tablets. The game—slated for release in August 2015—is a relatively simple archery simulation set in a series of medieval-style environments where players take into account distance, wind speed, and wind direction to hit the bull’s eye (Figure 1).

Players fire at traditional-looking targets in a rustic setting
Figure 1: Players fire at traditional-looking targets in a rustic setting.

Intrigued by the 3D input possibilities of the Intel® RealSense™ SDK and Intel® RealSense™ 3D Camera (F200), Allen saw the archery-based gameplay as a perfect opportunity to use hand and gesture tracking for the action of aiming and firing arrows.


Optimizations and Challenges


Gesture Controls

Longbow for Intel RealSense technology is played using the hand-tracking capabilities of the Intel RealSense 3D camera, with the player’s forward bow-holding hand used for aiming and the rear hand used to fire. To aim arrows, the game detects the first hand raised to the camera and records its initial 3D position, which then becomes the center point. The player then aims by moving the forward hand, with the game tracking the distance and direction of it in relation to the center point. Mimicking the action of a real archer, the natural choice is to hold the aiming hand in a fist, but this is not actually required by the game.

The following code tracks the user's hand movements. It first queries the mass center using the Intel RealSense SDK member function QueryMassCenterImage from the PXC[M]HandData interface.  If it finds that there hasn't been an initial orientation, it assumes the user has just raised their hand to the camera and recalibrates the starting point. Otherwise, it measures the distance the user has moved their hand from the initial point and interprets that movement in the game (in Longbow's case, it rotates the camera).

PXCMPointF32 imageLocation = data.QueryMassCenterImage();

        Vector3 normalizedImageLocation = new Vector3(imageLocation.x / input.colorWidth * 2f - 1f, imageLocation.y / input.colorHeight * 2f - 1f, 0f);

        if (initialOrientation == Vector3.zero)
        {
            if (!calibrating)
            {
                calibrationElapsed = 0f;
                moveDelta = Vector3.zero;
                calibrating = true;
            }
            else if (calibrationElapsed > .3f)
            {
                initialOrientation = new Vector3(-normalizedImageLocation.y, normalizedImageLocation.x, 0f);
                moveDelta = Vector3.zero;
                calibrating = false;
            }
        }

        if (initialOrientation == Vector3.zero) return;

        moveDelta = (initialOrientation - new Vector3(-normalizedImageLocation.y, normalizedImageLocation.x, 0f)) * sensitivity;

The next code snippet measures the user's hand depth in the same way. First, it finds if there is an existing point of reference, and if not, calibrates one. It then measures the delta (this time in depth) from the first point to get how far the player has pulled their hand back.

if (initialDepth == 0f)
        {
            initialDepth = data.QueryMassCenterWorld().z;
        }

        myDepth = data.QueryMassCenterWorld().z - initialDepth;

The player uses the other hand to pull back the arrow while the game uses depth tracking to measure its distance from the forward aiming hand (Figure 2). When the rear firing hand reaches a predetermined distance from the aiming hand, the arrow automatically fires.

Players use their hands to mimic the gestures of aiming and drawing a bow
Figure 2: Players use their hands to mimic the gestures of aiming and drawing a bow.

Allen originally tested a different and more realistic firing gesture whereby the action of opening the rear hand would release the arrow. However, the responsiveness of this gesture proved inconsistent and hence frustrating for players. As a result, the hand-opening gesture was abandoned during development in favor of the simpler depth-based mechanism.

Despite players occasionally misfiring arrows as they became accustomed to the maximum distance they could pull back without firing, the depth-based system proved to be much more reliable and accurate, resulting in a more enjoyable experience.

Interpolating Data

When using human physical motion as an input device―either through the use of a 3D camera or an accelerometer in a handheld device―a common issue is jittery on-screen movements. This is caused by the constant minute movements of the hand and the sensitivity of the input device―in this case the Intel RealSense camera―and the sheer volume of precise data it generates.

With Longbow, Allen used the Unity 3D function, “Lerp” (linear interpolation), a process that averages the input data to deliver smooth on-screen movement. The process identified the optimum number of times per second the game needed to pull the hand-detection data from the camera to prevent detectable lag for the user. This turned out to be 5 to 10 times per second (considerably lower than the game’s frame rate of 30 frames per second). Next, linear interpolation is applied to the data, which averages the input data and estimates where the hand will be. This process results in a smooth and accurate on-screen rendering of the player’s movements. Allen smoothed the camera’s rotation based on the moveDelta value calculated earlier. The smoothness value determines how much to smooth the input; too much and you get lagged movements, and too little causes the movement to jump around by tiny amounts.

transform.rotation = Quaternion.Lerp (transform.rotation,
Quaternion.Euler (moveDelta + new Vector3 (0f, yOffset, 0f)),
Time.deltaTime * smoothness);

Allen also discovered that pulling data from the Intel RealSense camera as infrequently as possible and applying interpolation reduces the load on the processor, which helps the game maintain a steady frame rate and run more smoothly. This is particularly helpful when running the game on less powerful devices and ultimately improves the overall user experience.


Optimizing the UX


The biggest issue Allen had during development was adapting the game’s user experience for the Intel RealSense camera. He initially explored applying gesture controls to the game’s entire user interface, from the menu selections right through to gameplay, to make the game accessible without the need for touch or a mouse and keyboard. Using gestures to stop, start, navigate the menus, and make selections worked on a functional and technical level, but Allen found that that the process fell significantly short in delivering an enjoyable user experience.
 

The first problem was the complexity of teaching the user what actions to use and where to use them. Players were required to memorize a set of three specific hand gestures to navigate the menu and start the game. Allen found that players would frequently confuse gestures resulting in unwanted outcomes. Additionally―particularly when the original fist closed-to-open firing gesture was still in the game―Allen found that players would sometimes trigger an unwanted action such as pausing the game, adding to their frustration.

No Offense

Another interesting challenge that Allen faced while implementing the initial gesture-controlled interface was making sure that the gestures recognized by the Intel RealSense SDK were appropriate for an international audience. For example, the “two-finger pinch” or OK symbol, which is made by bringing together the tips of the thumb and forefinger, has a potentially offensive meaning in the Brazilian culture. The inability to use certain commonly recognized gestures and the need to create original gestures made the process of creating a gesture control scheme that users would be able to memorize even more complex.

Heavy Hands

One unexpected issue that Allen found with the gesture controls was the physical discomfort players experienced from having to hold their hands in front of the camera throughout the game. This led to aching arms, which significantly reduced the fun factor. To address this issue, Allen modified the game to allow players to drop their hands between rounds, instructing the Intel RealSense camera to go through the process of detecting the hands again at the start of each new round.

Keeping With Tradition

Overall, the game’s initial gesture-only interface proved non-intuitive to players and added a layer of complexity to the navigation. In the end, both Allen and Intel agreed that the menu interface would work better using touch and traditional mouse and keyboard controls. In the case of Longbow where the game is played in close proximity to the camera and screen, using these traditional interface controls is easy and accessible for the player, and they delivered a significantly more intuitive and comfortable user experience.


Testing and Analysis


As an independent developer, Allen had no testing pool and conducted the local testing alone using only his own computer. Fortunately for Allen, working with the Intel RealSense SDK meant he was able to count on Intel’s support at each stage of development. He used the Intel RealSense SDK documentation provided during the early phases, relying more heavily on the support of Intel engineers as the project took shape. Throughout their collaboration, Intel provided valuable feedback on the implementation of the gesture controls, including for the interface and the actions of drawing and firing arrows.

The main problems that arose through testing were the arrow-release mechanism and the user interface as described previously. The initial firing mechanism involved opening the fist to release the arrow, and testing showed that many users were unable to consistently fire this way. This led directly to the implementation of the modified firing mechanism based on drawing distance, whereby the arrow is fired when the drawing hand reaches a certain distance away from the forward aiming hand. Testing also led to the return to traditional mouse, keyboard, and touch controls for the game’s main navigation.


Intel RealSense SDK: Looking Forward


Following his Intel-inspired discovery of the Windows* Store, Allen now develops games for web and Windows devices in addition to his core work for the mobile market. His keen interest in developing for emerging platforms is what led to his involvement with Intel and his work in bringing Longbow to the Intel RealSense SDK platform.

Developing for the Intel RealSense SDK opened Allen’s mind to a world of new possibilities, the first being head tracking and simulations, either in a game or in an actual simulator where, for example, the user is being taught a new skill. The ability to look around a virtual world without having to wear head gear is a capability that Allen has already experimented with in his previously released game Flight Theory*.

Allen believes that Intel RealSense technology is a new frontier offering exciting new user experiences that will be available to growing numbers of consumers once the hardware begins its commercial rollout.


What’s Next for Longbow


Longbow was initially developed for mobile platforms, and the Windows version currently uses the same art assets (Figure 3). Allen intended to upgrade the graphics when he began developing the Intel RealSense SDK-enabled version of the game, but unexpected UX challenges sidelined the task, although a visual update is still high on the list of priorities.

Allen borrowed from the past to add more fun and a frisson of danger to Longbow*
Figure 3: Allen borrowed from the past to add more fun and a frisson of danger to Longbow*.

Now that Allen has the Intel RealSense SDK Gold release, he might revisit the original finger-tracking gesture control for firing arrows, using the release finger movement rather than the pullback distance-sensitive release mechanism.


About the Developer


Driftwood Mobile is the studio of independent developer Jason Allen based in Tasmania, Australia. Allen initially founded the studio in 2008 to develop games for the blind and visually impaired, having noted that few experiences were available that adapted to that audience. Around the same time, the mobile gaming and app market was beginning to explode, a shift that Jason has successfully capitalized on with the release of five separate mobile titles to date. Collectively, the games have accumulated over 40 million downloads over the last three years, with bowling game Galaxy Bowling* being the most successful, both in terms of user numbers (currently approximately one million active users) and revenue.

Allen is currently exploring how to make Galaxy Bowling (Figure 4) accessible for the blind and visually impaired with the vital support from the community. According to Allen, the core challenge in adapting a game for visually impaired players is distilling the large amount of information simultaneously displayed on a screen to comprehensible audio-based directions, which need to be delivered in a linear sequence so the player can process them. Allen aims to take the experience beyond coded bleeps of early games, using more realistic sound effects to direct the player, with his experiments so far proving surprisingly successful in delivering a fun experience.

Galaxy Bowling* for iOS* and Android* devices is Allen’s most successful title to date
Figure 4: Galaxy Bowling* for iOS* and Android* devices is Allen’s most successful title to date.


Additional Resources


Driftwood Mobile developer website

Intel® Developer Zone for RealSense™ Technology

Intel RealSense SDK

Intel® RealSense™ Developer Kit

Intel RealSense Technology Tutorials


How to get working Windows Hello on actual Windows 10 Insider Preview

$
0
0

One of the cool new features announced for the upcoming WIndows10 is Windows Hello.

It's essentially a new way to login in the system with an exclusive face recognition feature that auto log the user when it come in front of its PC.

How it works

This magic feature is based on a magic technology that tag a face and can recognize it back securely.

The recognition is done using two type of camera in cooperation; the first is a classical HD camera and the second is a depth camera (infrared) for 3D an temperature scanning.

The system recognize and match a lot of point describing specific target of the face, the eyes, the lips, the nose etc; describing a precise path different for each person and assigning to this array of points a specific and unique tag.

When the system come in non-logged state it automatically try to recognize the face coming behind it and matching with the one archived for the local Windows Hello, if a match is done it auto log to the corresponding user profile.

On the Windows10 side the game is done by Passport that log you to the system (using the PIN password) only when the biometric device (in this case the camera) acknowledge the recognition of you face; it works essentially in the same manner on all the device with a fingerprint reader embedded. The system already manage also the retina scan login, but you will obviously need a specific retina scan device.

Obviously it doesn't work with photo, or miniature of the face.....

What whe need to get it work

Actually there's only one standalone device certified for Windows hello, the Intel Realsense camera F200.

It's a 3D camera part of a Intel Dev Kit Developed by Intel named Realsense SDK: this SDK is a big set o free library to enable feature like Face recognition, face detection, object tracking, gesture recognition, speech synthesys and speech recognition. You can freely download it from this link.

Otherwise you need a device with a Realsense camera onboard (click here for a full list).

You  only need a device running Windows 10 (the Insider Technical preview also).

How to do it

Connect the camera to you Win 10 device, the system will automatically recognize some new devices

In order to install the new available driver and eventualy update the formware of the camera we need to download and install  the "Intel RealSense Depth Camera Manager (DCM)" software from Intel at this link.

After the download install and run it, follow instruction to update driver and firmware of the camera.

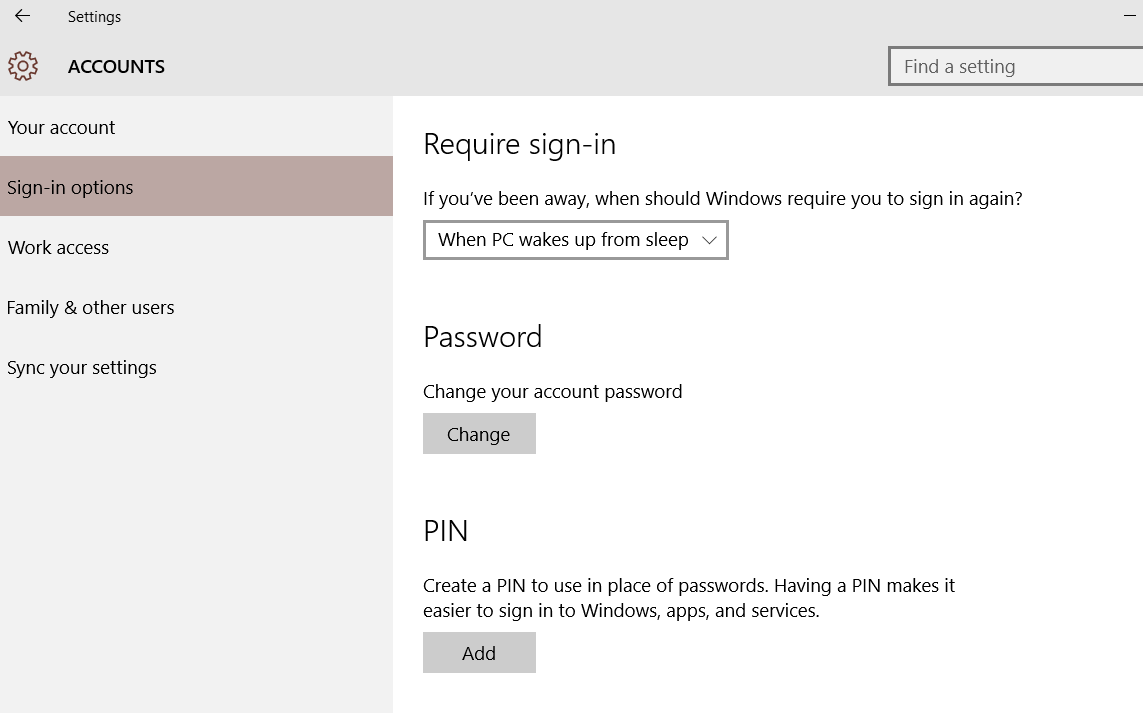
For the next step go to Windows 10 Settings/Accounts/Sign In options and define PIN password.


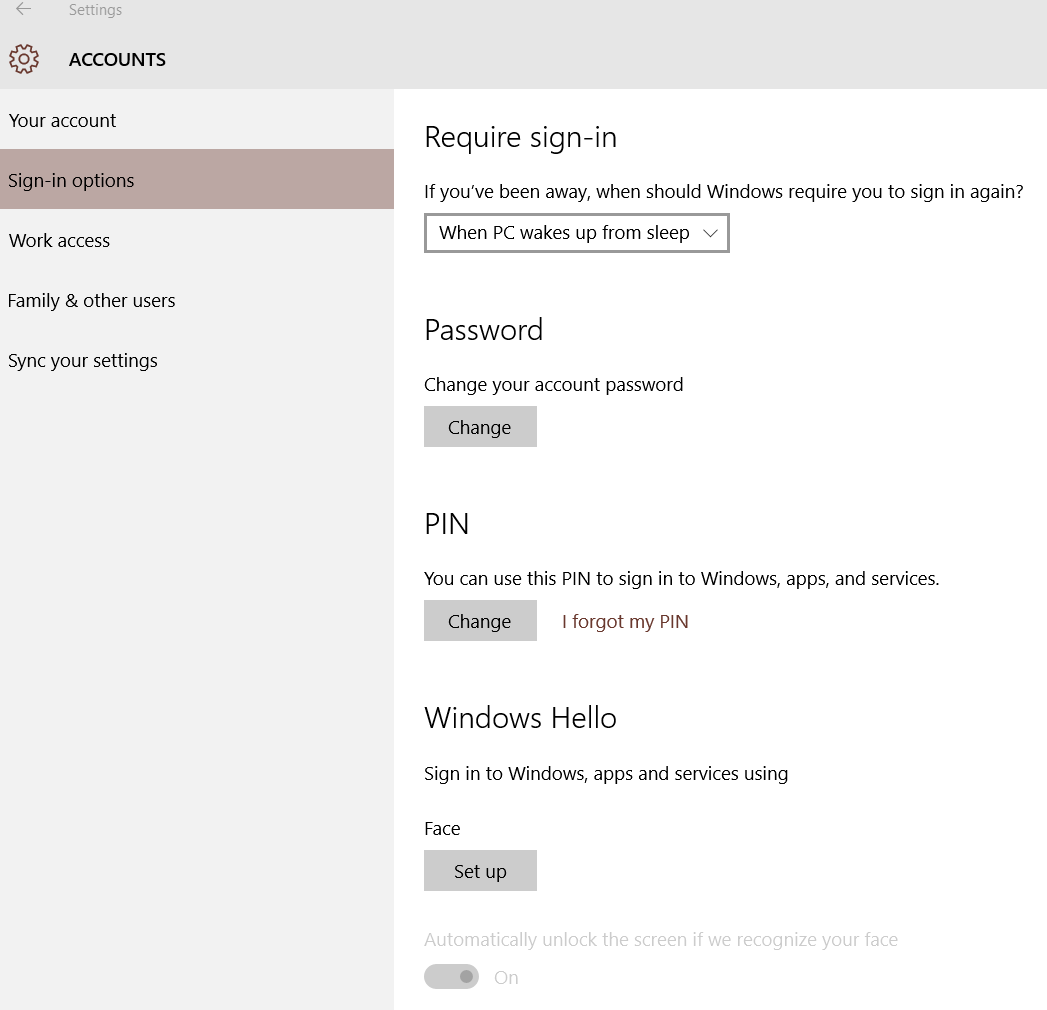
Once defined it close and reopen Settings /Accounts/Sign-in options you'll see also a Windows Hello option!

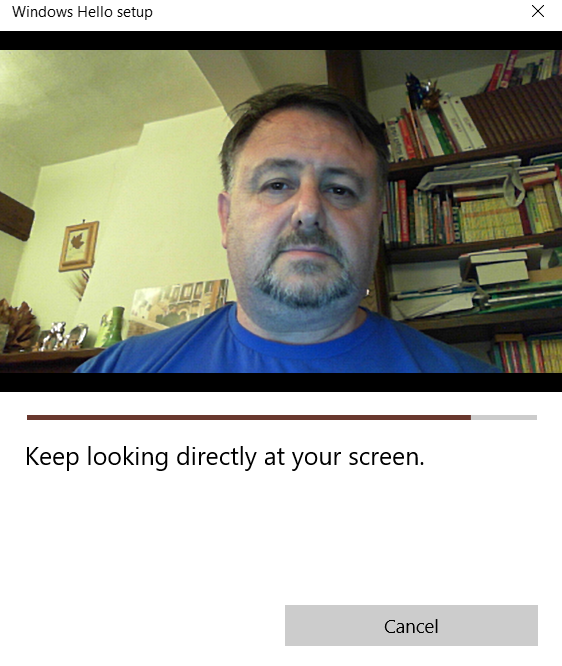
Click on Set Up, press Get Started, the system will ask for you PIN password, enter it and a preview of the image captured from the F200 camera will appear.

Once the operation end succesfully the system will show the message AllSet!

Close the window and try immediately to sign out from actual session.

When the system return to the login page will immediately recognize you (if you are still in front of your PC obviously) and auto login in your profile.


Thats it!

Enjoy

You Can Join Selected IDF Sessions From Wherever You Are!

$
0
0

IDF Date: Aug 18 - Aug 20, 2015

Can’t attend IDF in person this year?  We have you covered.  Selected software sessions will be webcasted which will give you the opportunity to join our experts live.  See the schedule below and register now:


Cross-Platform Mobile App Development With Native Performance Using Intel® Integrated Native Developer Experience

Abstract: With native look and feel, performance and portability across multiple target mobile OS and architectures, Intel® Integrated Native Developer Experience (Intel® INDE)
is a one-stop productivity suite that brings together a great arsenal of application development tools and libraries to expose advanced platform capabilities.
Come to this session to see:
• Intel INDE in action developing Android* and cross-OS apps with rich media experience
• Live demos showcasing apps built with innovative SDKs and tools included in Intel INDE
• How companies such as Open Labs*, Audible Magic* and 23Snaps* are using Intel INDE to develop native applications for multiple platforms that stand out in the marketplace

Register


Parallel Programming Pearls: Inspired by Intel® Xeon Phi™ Products

Abstract: This session dives into real-world parallel programming optimization examples, from around the world, through the eyes and wit of enthusiast, author, editor and evangelist James Reinders.
This session will explore:
• Concrete real world examples of how Intel® Xeon Phi™ products extend parallel programming seamlessly from a few cores to many-cores (over 60) with the same programming models
• Examples from the newly released book, “High Performance Parallelism Pearls Volume 2”, will be highlighted with source code for all examples freely available.

Register


Intel® XDK HTML5 Cross-Platform Development Environment - Building Cordova Apps with Crosswalk Project

Abstract: Join Paul Fischer as he discusses how the Intel® XDK HTML5 Cross-Platform Development Environment enables developers to create mobile Cordova apps for Android*, iOS* and Windows* phones and tablets. With the Intel® XDK HTML5 Cross-Platform Development Tools and Crosswalk Project runtime, high-performance apps can be easily debugged and profiled in real-time, directly on-device. By providing a complete set of tools to create, build, test and debug mobile apps, the Intel® XDK helps speed the development cycle for HTML5 apps, by enabling developers to quickly and easily create apps for multiple app stores, across diverse devices.

In this session you will hear about:
• Finding performance and memory bottlenecks in Crosswalk Project HTML5 apps
• Improving app quality with real-time on-device debug and test
• Enhancing performance, especially for games and interactive applications
• Taming the Android native Webview problem with a modern Blink Webview

Register


Coding for Maximum Utilization of Next Generation Intel® Processors in the IoT Era

Abstract: Join Noah Clemons as he leads a discussion with a variety of Intel® Architecture based system optimization experts from Intel together to address the following:
• System-on-chip complexity – new features on System-on-Chips (SoCs)
• Application of those features to several different IoT domains
• Fastest ways to maximize new SoC features through software
• In-depth system-wide tracing, debugging, performance and power analysis
• Tools eco-system to support the latest and next generation Intel® Architecture based SoCs

Register

High Performance Image Processing Solution with Intel® Platform Technology

$
0
0

High Performance Image Processing Solution with Intel® Platform Technology


Abstract


With the increasing popularity of internet and media cloud applications, huge volume of image data has been generated, utilized and shared every day, that presents the big computing and storage challenges to the media related industry and company. In this paper, we study the techniques of most popular image processing, analyze the performance challenge, explore the tuning methodology, and implement the most effective solution based on IA platform. We aim to maximize IA platforms’ capabilities for typical image processing workloads, achieve best performance and efficiency to benefit the most popular internet and media industry.

Using OpenCL™ 2.0 Read-Write Images

$
0
0

Acknowledgements

We want to thank Javier Martinez, Kevin Patel, and Tejas Budukh for their help in reviewing this article and the associated sample.

Introduction

Prior to OpenCL™ 2.0, there was no ability to read and write to an image within the same kernel. Images could always be declared as a “CL_MEM_READ_WRITE”, but once the image was passed to the kernel, it had to be either “__read_only” or “__write_only”.

input1 = clCreateImage(
oclobjects.context,
CL_MEM_READ_WRITE|CL_MEM_COPY_HOST_PTR,&format,&desc,&input_data1[0],&err );
SAMPLE_CHECK_ERRORS( err );

Code 1. Image buffer could be created with CL_MEM_READ_WRITE

__kernel void Alpha( __read_write image2d_t inputImage1,
__read_only image2d_t
inputImage2,
uint width,
uint height,
float alpha,
float beta,
int gamma )

Code 2. OpenCL 2.0 introduced the ability to read and write to images in Kernels

The addition, while intuitive, comes with a few caveats that are discussed in the next section.

The value of Read-Write Images

While Image convolution is not as effective with the new Read-Write images functionality, any image processing technique that needs be done in place may benefit from the Read-Write images. One example of a process that could be used effectively is image composition.

In OpenCL 1.2 and earlier, images were qualified with the “__read_only” and __write_only” qualifiers. In the OpenCL 2.0, images can be qualified with a “__read_write” qualifier, and copy the output to the input buffer. This reduces the number of resources that are needed.

Since OpenCL 1.2 images are either read_only or write_image. Performing an in-place modifications of an image requires treating the image as a buffer and operating on the buffer (see cl_khr_image2d_from_buffer: https://software.intel.com/en-us/articles/using-image2d-from-buffer-extension.

The current solution is to treat the images as buffers, and manipulate the buffers. Treating 2d images as buffers many not be a free operation and prevents clamping and filtering abilities available in read_images from being used. As a result, it may be more desirable to use read_write qualified images.

Overview of the Sample

The sample takes two windows bitmap images “input1.bmp” and “input2.bmp” and puts them into an image buffer. These images are then composited based on the value of the alpha, a weight factor in the equation of the calculated pixel, which can be passed in as an option.

Using Alpha value 0.84089642

Figure 1. Using Alpha value 0.84089642

The images have to be either 24/32-bit images. The output is a 24-bit image. The images have to be of the same size. The images were also of the Format ARGB, so when loading that fact was taken into consideration.

Using Alpha value of 0.32453

Figure 2. Using Alpha value of 0.32453

The ARGB is converted to RGBA. Changing the value of the beta value causes a significant change in the output.

Using the Sample SDK

The SDK demonstrates how to use image composition with Read write images. Use the following command-line options to control this sample:

Options

Description

-h, --help

Show this text and exit

-p, --platform number-or-string

Select platform, devices of which are used

-t, --type all | cpu | gpu | acc | default | <OpenCL constant for device type>

Select the device by type on which the OpenCL Kernel is executed

-d, --device number-or-string

Select the device on which all stuff is executed

-i, --infile 24/32-bit .bmp file

Base name of the first .bmp file to read. Default is input1.bmp

-j, --infile 24/32-bit .bmp file

Base name of the second .bmp file to read Default is input2.bmp

-o, --outfile 24/32-bit .bmp file

Base name of the output to write to. Default is output.bmp for OCL1.2 and 20_output.bmp for OCL2.0

-a, --alpha floating point value between 0 and 1

Non-zero positive value that determines how much the two images will blend in composition. Default alpha is 0.84089642. Default beta value is 0.15950358.

The sample SDK has a number of default values that allow the application to be able to run without any user input. The user will be able to use their input .bmp files. The files have to be either 24/32 bmp files as well. The alpha value is used to determine how much prominence image one will have over image 2 as such:

calculatedPixel = ((currentPixelImage1 * alpha) + (currentPixeImage2 * beta) + gamma);

The beta value is determined by subtracting the value of the alpha from 1.

float beta = 1 – alpha;

These two values determine the weighted distribution of images 1 to image 2.

The gamma value can be used to brighten each of the pixels. The default value is 0. But user can brighten the overall composited image. 

Example Run of Program

Read Write Image Sample Program running on OCL2.0 Device

Figure 3. Program running on OpenCL 2.0 Device

Limitations of Read-Write Images

Barriers cannot be used with images that require synchronization across different workgroups. Image convolution requires synchronizing all threads. Convolution with respect to images usually involves a mathematical operation on two matrices that results in the creation of a third matrix. An example of an image convolution is using Gaussian blur. Other examples are image sharpening, edge detection, and embossing.

Let’s use Gaussian blur as an example. A Gaussian filter is a low pass filter that removes high frequency values. The implication of this is to reduce detail and eventually cause a blurring like effect. Applying a Gaussian blur is the same as convolving the image with a Gaussian function that is often called the mask. To effectively show the functionality of Read-Write images, a horizontal and vertical blurring had to be done.

In OpenCL 1.2, this would have to be done in two passes. One kernel would be exclusively used for the horizontal blur, and another does the vertical blur. The result of one of the blurs would be used as the input of the next one depending on which was done first.

__kernel void GaussianBlurHorizontalPass( __read_only image2d_t inputImage, __write_only image2d_t outputImage, __constant float* mask, int maskSize)
{
    int2 currentPosition = (int2)(get_global_id(0), get_global_id(1));
    float4 currentPixel = (float4)(0,0,0,0);
    float4 calculatedPixel = (float4)(0,0,0,0);
    for(int maskIndex = -maskSize; maskIndex < maskSize+1; ++maskIndex)
    {
        currentPixel = read_imagef(inputImage, imageSampler, currentPosition + (int2)(maskIndex, 0));
        calculatedPixel += currentPixel * mask[maskSize + maskIndex];
    }
    write_imagef(outputImage, currentPosition, calculatedPixel);
}

__kernel void GaussianBlurVerticalPass( __read_only image2d_t inputImage, __write_only image2d_t outputImage, __constant float* mask, int maskSize)
{
    int2 currentPosition = (int2)(get_global_id(0), get_global_id(1));
    float4 currentPixel = (float4)(0,0,0,0);
    float4 calculatedPixel = (float4)(0,0,0,0); 
    for(int maskIndex = -maskSize; maskIndex < maskSize+1; ++maskIndex)
    {
        currentPixel = read_imagef(inputImage, imageSampler, currentPosition + (int2)(0, maskIndex));
        calculatedPixel += currentPixel * mask[maskSize + maskIndex];
    }
    write_imagef(outputImage, currentPosition, calculatedPixel);
}

Code 3. Gaussian Blur Kernel in OpenCL 1.2

The idea for the OpenCL 2.0 would be to combine these two kernels into one. Use a barrier to force the completion of each of the horizontal or vertical blurs before the next one begins.

__kernel void GaussianBlurDualPass( __read_only image2d_t inputImage, __read_write image2d_t tempRW, __write_only image2d_t outputImage, __constant float* mask, int maskSize)
{
    int2 currentPosition = (int2)(get_global_id(0), get_global_id(1));
    float4 currentPixel = (float4)(0,0,0,0);  
    float4 calculatedPixel = (float4)(0,0,0,0)
    currentPixel = read_imagef(inputImage, currentPosition);
    for(int maskIndex = -maskSize; maskIndex < maskSize+1; ++maskIndex)
    {
        currentPixel = read_imagef(inputImage, currentPosition + (int2)(maskIndex, 0));     
        calculatedPixel += currentPixel * mask[maskSize + maskIndex];
    }
    write_imagef(tempRW, currentPosition, calculatedPixel);

    barrier(CLK_GLOBAL_MEM_FENCE);

    for(int maskIndex = -maskSize; maskIndex < maskSize+1; ++maskIndex)
    {
        currentPixel = read_imagef(tempRW, currentPosition + (int2)(0, maskIndex));
        calculatedPixel += currentPixel * mask[maskSize + maskIndex];
    }
    write_imagef(outputImage, currentPosition, calculatedPixel);
}

Code 4. Gaussian Blur Kernel in OpenCL 2.0

Barriers were found to be ineffective. Using a barrier does not guarantee that the horizontal blur is completed before the vertical blur begins, assuming you did the horizontal blur first. The implication of this was an inconsistent result in multiple runs. Barriers can be used to synchronize threads within a group. The reason the problem occurs is that edge pixels are read from multiple workgroups, and there is no way to synchronize multiple workgroups. The initial assumption that we can implement a single Gaussian blur using read_write images proved incorrect because the inter-workgroup data dependency cannot be synchronized in OpenCL.

References

About the Authors

Oludemilade Raji is a Graphics Driver Engineer at Intel’s Visual and Parallel Computing Group. He has been working in the OpenCL programming language for 4 years and contributed to the development of the Intel HD Graphics driver including the development of OpenCL 2.0.


Robert Ioffe is a Technical Consulting Engineer at Intel’s Software and Solutions Group. He is an expert in OpenCL programming and OpenCL workload optimization on Intel Iris and Intel Iris Pro Graphics with deep knowledge of Intel Graphics Hardware. He was heavily involved in Khronos standards work, focusing on prototyping the latest features and making sure they can run well on Intel architecture. Most recently he has been working on prototyping Nested Parallelism (enqueue_kernel functions) feature of OpenCL 2.0 and wrote a number of samples that demonstrate Nested Parallelism functionality, including GPU-Quicksort for OpenCL 2.0. He also recorded and released two Optimizing Simple OpenCL Kernels videos and GPU-Quicksort and Sierpinski Carpet in OpenCL 2.0 videos.


You might also be interested in the following:

Optimizing Simple OpenCL Kernels: Modulate Kernel Optimization

Optimizing Simple OpenCL Kernels: Sobel Kernel Optimization

GPU-Quicksort in OpenCL 2.0: Nested Parallelism and Work-Group Scan Functions

Sierpiński Carpet in OpenCL 2.0

Downloads

Pulse Detection with Intel® RealSense™ Technology

$
0
0

1. Introduction

When I first heard of a system that could determine your heart rate without actually touching you, I was sceptical to the point where I dismissed the claim as belonging somewhere between fakery and voodoo. Many moons later I had a reason to look deeper into the techniques required and realized it was not only possible, but had already been achieved, and furthermore had been implemented in the latest version of the Intel® RealSense™ SDK.

It was only when I located and ran the appropriate sample program from the SDK, read the value, and then checked it against my own heart rate by counting the beats in my neck for 15 seconds and multiplying by four, that I realized it actually works! I jumped up and down a little to get my heart rate up, and amazingly, after some seconds, the computer once again accurately calculated my accelerated rate. Of course by this time I was so pumped at the revelation and excited at the prospects of a computer that knows how calm you are, that I could not get my heart rate down below my normal 76 beats per minute to test the lower levels.


2. Why Is This Important

Once you begin your journey into the frontier world of hands-free control systems, 3D scanning, and motion detection, you will eventually find yourself asking what else you can do with the Intel® RealSense™ camera. When you move from large clearly defined systems to the more subtle forms of detection, you enter a realm where computers gain abilities never seen before.

Pulse detection, along with other Intel RealSense SDK features, are much more subtle streams of information that may one day play as critical a role in your daily life as your keyboard or mouse.  For example, a keyboard or mouse is no good to you if you’re suffering from RSI (Repetitive Strain Injury) and no amount of clever interfacing will help you if you’re distracted, agitated, sleepy, or simply unhappy.  Using the subtle science of reading a user’s physical and possible emotional condition allows the computer to do something about it for the benefit of the user and improve that experience. Let’s say it’s nine thirty in the morning, the calendar shows a full day of work ahead, and the computer detects the user is sleepy and distracted. Using some pre-agreed recipes, the computer could trigger your favourite ‘wake me up with 5 power ballads’ music, flash up your calendar for the next 4 hours and throw some images of freshly brewed coffee on screen as a gentle reminder to switch up a gear. 

Technological innovation isn’t always about what button does what or how we can make things quicker, easier, or smarter, it can also be about improving quality of life and enriching an experience. If your day can be made better because your computer has a sense of what you might need and then takes autonomous steps to help you, that can only be a good thing.

By way of another example and not directly related to pulse detection, imagine your computer is able to detect temperature and notices that when you get hot your work rate drops (i.e., less typing, more distracted, etc.) and also records that when the temperature was cooler, your work level increases. Now imagine it recorded sensor metrics about you on a daily basis, and during a particularly hot morning your computer flashes a remark that two days ago you had also been hot, you left the desk for 20 seconds, and 2 minutes later everything was cool (and your subsequent work level improved that day). Such a prompt might recall a memory that you opened a few windows, or turned on the air conditioning in the next room, and so you follow the advice and your day improves. Allowing the computer to collect this kind of data and experimenting with the ways in which this data can improve your own life will ultimately lead to innovations that will improve life for everyone.

Pulse estimation is just one way in which a computer can extract subtle data from the surrounding world, and as technology evolves, the sophistication of pulse detection will lead to readings as accurate as traditional methods.


3. How Is This Even Possible?

My research into precisely how pulse estimation currently works took me on a brief journey through the techniques that have proved to be successful so far, such as detecting what are so called micro-movements in the head.

Detecting micro-movements in the head

You need more than a tape measure to detect micro-movements in the head.

Apparently when your heart beats, a large amount of blood is pumped into your head to keep your brain happy, and this produces an involuntary and minuscule movement that can be detected by a high resolution camera. By counting these movements, filtered by normal Doppler and other determinable movements, you can work out how many beats the user is likely to have per minute. Of course, many factors can disrupt this technique such as natural movements that can be mistaken for micro-movements, or capturing shaky footage if you are in transit at the time, or you are simply cold and shivering. Under regulated conditions, this technique has been proven to work with nothing more than a high resolution color camera and software capable of filtering out visual noise and detecting the pulses.

Another technique that is closer to the method used by the Intel RealSense SDK is the detection of color changes in a live stream and using those color changes to determine if a pulse happened. The frame rate does not have to be particularly high for this technique to work, nor does the camera need to be perfectly still, but the lighting conditions need to be ideal for the best results. This alternative technique has a number of variations, each with varying levels of success, two of which I will briefly cover here.

Your eyes can tell you how fast your heart is beating

Did you know your eyes can tell you how fast your heart is beating?

Obviously, the technique works better when you are not wearing glasses, and with a high resolution capture of the eyeball you have an increased chance of detecting subtle changes in the blood vessels of the eye over the course of the detection phase. Unlike veins under the skin that are subject to subsurface scattering and other occlusions, the eye offers a relatively clear window into the vascular system of the head. You do have a few hurdles to overcome, such as locking the pixels for the eye, so you only work with the eye area and not the surrounding skin. You also need to detect blinking and track pupils to ensure no noise gets into the sample, and finally you need to run the sample long enough to get a good sense of background noise that needs to be eliminated before you can magnify the remaining color pixels to help in detecting the pulse.

Your mileage will vary as to how long you need to run the sample, and there will be a lot of noise that will mean you have to throw the sample out, but even by running at a modest 30 frames per second you’ll have anywhere from 20-30 samples to find just one pulse (assuming your subject has a heart rate from between 60 to 90 beats per minute).

If you find the color information from the eye is insufficient, such as might occur for users who are sitting a good distance away from the computer, wearing glasses, or meditating, then you need another solution. One more variation on the skin color change method is the use of the IR stream (InfraRed), which is readily provided by the Intel® RealSense™ camera. Unlike color and depth streams, IR streams can be sent to the software at upwards of 300 frames per second, which is quite fast. As suggested before, however, we only need around 30 frames per second of good quality samples to find our elusive pulse, and the IR image you get back from the camera has a special trick to reveal.

Infra-Red detecting the veins in the wrist

Notice the veins in the wrist, made highly visible thanks to Infra-Red

For the purpose of brevity, I will not launch into a detailed description of the properties of IR and its many applications. Suffice it to say that it occupies a specific spectrum of light that the human eye cannot entirely perceive. The upshot is that when we bounce this special light off objects, capture the results, and convert them to something we can see, it reacts a little differently than its neighboring colors higher up the spectrum.

One of the side effects of bouncing IR off a human is that we can detect veins near the surface of the skin and other characteristics such as detecting grease on an otherwise perfectly clean shirt. Given that blood flow is the precise metric we want to measure you might think this approach is perfectly suited to the job of detecting a heart rate. With a little research you will find that IR has indeed been used for the purpose of scanning the human body and detecting the passage of blood around the circulatory system, but only under strict medical conditions. The downside to using IR is that you effectively limit the information you are receiving from the camera and must throw away the equally valuable visible spectrum returned via the regular RGB color stream.

Of course, the ultimate solution is to combine all three sources of information; taking micro-movements, IR blood flow, and full color skin changes to act as a series of checks and balances to reject false positives and produce a reliable pulse reading.


4. How Intel® RealSense™ Technology Detects Your Pulse

Now that you know quite a bit about the science of touchless heart rate detection, we are going to explore how you can add this feature to your own software. You are free to scan the raw data coming from the camera and implement one or all of the above techniques, or thanks to the Intel RealSense SDK you can instead implement your own heart rate detection in just a few lines of code.

The first step is not specifically related to the pulse detection function, but for clarity we will cover it here so you have a complete picture of which interfaces you need and which ones you can ignore for now. We first need to create a PXC session, a SenseManager pointer, and a faceModule pointer as we will be using the Face system to eventually detect the heart rate. For a complete version of this source code, the best sample to view and compile against is the Face Tracking example, which contains the code below but with support for additional features such as pose detection.

PXCSession* session = PXCSession_Create();
PXCSenseManager* senseManager = session->CreateSenseManager();
senseManager->EnableFace();
PXCFaceModule* faceModule = senseManager->QueryFace();

Once the housekeeping is done and you have access to the critical faceModule interface, you can make the pulse-specific function calls, starting with the command to enable the pulse detector.

PXCFaceConfiguration* config=faceModule->CreateActiveConfiguration();
config->QueryPulse()->Enable();
config->ApplyChanges();

The ActiveConfiguration object encompasses all the configuration you need for the Face system, but the one line that specifically relates to getting a heart rate reading is the function to QueryPulse()->Enable(), which activates this part of the system and starts it running.

The final set of commands drills down to the value we are after, and as you can see below relies on parsing through all the faces that may have been detected by the system. It does not assume that a single user is sitting at the computer—someone could be looking over your shoulder or standing in the background. Your software must make additional checks, perhaps using the pose data structure, to determine which is the main head (perhaps the closest) and only use the heart rate for that face/user. Below is the code that makes no such distinction and simply moves through all the faces detected and takes the heart rate for each one, though it does nothing with the value in this example.

PXCFaceData* faceOutput = faceModule->CreateOutput();
const int numFaces = faceOutput->QueryNumberOfDetectedFaces();
for (int i = 0; i < numFaces; ++i)
{
	PXCFaceData::Face* trackedFace = faceOutput->QueryFaceByIndex(i);
	const PXCFaceData::PulseData* pulse = trackedFace->QueryPulse();
	if (pulse != NULL)
	{
		pxcF32 hr = pulse->QueryHeartRate();
	}
}

You can ignore most of the code except for the trackedFace->QueryPulse() which asks the system to work out the latest heart rate from the data collected thus far, and if data is available, to use the pulse->QueryHeartRate() to interrogate that data and return the heart rate in beats per minute.

An expression of surprise during the pulse estimate

An expression of surprise as the pulse estimate was exactly right.

By running the Face Tracking sample included with the Intel RealSense SDK and deselecting everything from the right except detection and pulse, then pressing start, you will be greeted with your own heart rate after 10 seconds of staying relatively still.

Once you have stripped out the non-pulse code from the above example, you can use it as a good code base for further experiments with the technique. Perhaps drawing a graph of the readings over time, or adding code to have the app run in the background and produce an audible beep to let you know when you’re getting too relaxed or excited. More seriously, you can monitor the accuracy and resolution of the readings returned to determine if they are sufficient for your application.


5. Tricks and Tips

Do’s

  • For best results not only when detecting your heart rate but for all capture work, use the camera in good lighting conditions (not exposed to sunlight) and stay relatively still during the sampling phase until you get an accurate reading.
  • As the current SDK only provides a single function for the detection of pulse, the door is wide open for innovators to use the range of raw data to obtain more accurate and instant readings from the user. The present heart rate estimate takes over 10 seconds to calculate, can you write one that performs the measurement in less time?
  • If you want to perform heart rate estimation outdoors and want to write your own algorithm to perform the analysis, it is recommended you use the color stream only for detecting skin color changes.

Don’ts

  • Don’t try to detect a heart rate with all the options in FaceTracking activated as this will reduce the quality of the result or fail to report a value altogether. You will need sufficient processing power available for the Face module to accurately estimate the heart rate.
  • Don’t use an IR detection technique in outdoor spaces as any amount of direct sun light will completely obliterate the IR signals returned, rendering any analysis impossible.


6. Summary

As touched on at the start of this article, the benefits of heart rate detection are not immediately apparent when compared to the benefits of hands-free controls and 3D scanning, but when combined with other sensory information can provide incalculable help to the user when they need it most. We’re not yet at the stage where computers can record our heart rate simply by walking past the doctor’s office window, but we’re half way there and it’s only a matter of time and further innovation and application before we see it take its place in our modern world.

From a personal perspective, living the life of an overworked, old-school, code-crunching relic, my health and general work ethic are more important to me now than in my youth, and I am happy to get help from any quarter that provides it. If that help takes the form of a computer nagging me to ‘wake up, drink coffee, eyes front, don’t forget, open a window, take a break, eat some food, go for a walk, play a game, go to the doctor you don’t have a pulse, listen to Mozart, and go to sleep’—  especially if it’s a nice computer voice—then so be it.

Of course being a computer, if the nagging gets a little persistent you can always switch it off. Something tells me though that we’ll come to appreciate these gentle reminders, knowing that behind all the cold logic, computers are only doing what we asked them to do, and at the end of the day, we can all use a little help, even old-school, code-crunching relics.


About The Author

When not writing articles, Lee Bamber is the CEO of The Game Creators (http://www.thegamecreators.com), a British company that specializes in the development and distribution of game creation tools. Established in 1999, the company and surrounding community of game makers are responsible for many popular brands including Dark Basic, The 3D Game Maker, FPS Creator, App Game Kit (AGK) and most recently, Game Guru.

Intel Texture Compression Plugin for Photoshop*

$
0
0

Achievement Unlocked Badge

Intel is working to extend Photoshop* to take advantage of the latest image compression methods (BCn/DXT) via plugin. The purpose of this plugin is to provide a tool for artists to access superior compression results at optimized compression speeds within Photoshop*.

Sign Up for Beta


Before Compression

Test strip before compression

After BC7 (Fine) Compression

Test Strip After BC7 (Fine) Compression


Benefits

Context Menu

  • Access to hardware supported superior compression results
  • Compression at optimized speeds
  • Previewing and convenience features to aid productivity
  • Runs within established content tool
  • Pluggable architecture for future compression schemes


Key Features

File Menu Export

  • Multiple image format support for BCn,
  • Export with DirectX10 extended header for sRGB
  • Choice of Fast and Fine (more accurate) compression
  • Support for alpha maps, color maps, normal maps
  • Support for cube maps with BCn compression
  • Real-time preview to visualize quality trade-offs
  • Photoshop Batch/Action support
  • Extensible


Export Formats

Formats

Available formats change based on Texture Type chosen. Contextual guidance in simple terms is also provided. Color format list shown at left. Full list shown below.

BC1RGB4BPP 
BC1sRGB4BPP 
BC3RGBA8BPP 
BC3sRGBA8BPP 
BC4R4BPPGrayscale
BC5RG8BPP2 Channel Tangent Map
BC6HRGB8BPPFast Compression
BC6HRGB8BPPFine Compression
BC7RGBA8BPPFast Compression
BC7RGBA8BPPFine Compression
BC7sRGBA8BPPFast Compression
BC7sRGBA8BPPFine Compression
NoneRGBA32BPPUncompressed

Beta Requirements

  • Window (32/64) versions 7, 8, 10
  • Photoshop CS6 through CC2015

Reference


Feedback is Welcome

Sign up on IDZ to Join the Conversation


More Comparisons

Preview BC7 Fast Comparison

Preview BC7 Fine Comparison

Intel Software - Achievement Unlocked

* Other names and brands may be claimed by their owners.
© Copyright 2015 Intel Corporation. All rights reserved. Intel, the Intel logo, Intel Atom, Intel Core, Intel Xeon and Intel Iris are trademarks of Intel Corporation in the U.S. and/or other countries.

OpenCV 3.0.0 ( IPP & TBB enabled ) on Yocto with Intel® Edison with new Yocto image release

$
0
0

For OpenCV 3.0.0 - Beta , please see this article

The following article is for OpenCV 3.0.0 and Intel(R) Edison with the latest (ww25) Yocto Image.

< Overview >

 This article is a tutorial for setting up OpenCV 3.0.0 on Yocto with Intel® Edison. We will build OpenCV 3.0.0 on Edison Breakout/Expansion Board using a Windows/Linux host machine.

 In this article, we will enable Intel® Integrated Performance Primitives ( IPP ) and Intel® Threading Building Blocks ( TBB ) to optimize and parallelize some OpenCV functions. For example, cvHaarDetectObjects(...) , an OpenCV function that detects objects of different sizes in the input image, is parallelized with the TBB library. By doing this, we can fully utilize the dual-core of Edison.

1. Prepare the new Yocto image for your Edison

   Go to Intel(R) Edison downloads and download 'Release 2.1 Yocto* complete image' and 'Flash Tool Lite' that matches your OS. Then refer Flash Tool Lite User Manual for Edison to flash the new image. Using this new release, you don't need to manually enable UVC for Webcams and will have enough storage space for OpenCV 3.0.0. Additionally, CMake is already included. To enable UVC by customizing the Linux Kernel and change partition setting for different space configuration, refer the past article's step 2 and 3. 

2. Setup root password and WiFi for ssh and FTP

  Follow Edison Getting Started to connect your host and Edison as you want.

  Setup any FTP method for transferring files from your host to your Edison. ( For an easy file transfer, MobaXterm is recommended for Windows hosts )

3. OpenCV 3.0.0

 When you check your space with 'df -h', you will see a very similar result with the following. 

  Go to OpenCV Official Page and download OpenCV on your host machine. When download is done, copy the zip file to your Edison through FTP. It is recommended to copy the OpenCV to '/home/<User>' and work it out there. Since '/home' has more than 1G.

 Unzip the downloaded file by typing 'unzip opencv-3.0.0.zip' and check if your opencv folder is created.

 go to <OpenCV DIR> and type 'cmake .' and take a look what kind of options are there.

 We will enable IPP and TBB for better performance. The library to enable IPP and TBB will be downloaded automatically when the flag is turned on. 

 Now, on Edison, go to <OpenCV DIR> and type ( do not forget '.' at the end of the command line )

 root@edison:<OpenCV DIR># cmake -D WITH_IPP=ON -D WITH_TBB=ON -D BUILD_TBB=ON -D WITH_CUDA=OFF -D WITH_OPENCL=OFF -D BUILD_SHARED_LIBS=OFF -D BUILD_PERF_TESTS=OFF -D BUILD_TESTS=OFF .

 which turns on IPP & TBB flags and turns off irrelevant features to make it simple. With 'BUILD_SHARED_LIBS=OFF' , your Edison will make the executables able to run without OpenCV installed in case of distribution. ( If you don't want IPP & TBB, go with WITH_TBB=OFF and WITH_IPP=OFF )

 In the configuration result, you should see IPP and TBB are enabled.

If you observe no problems, then type

 root@edison:<OpenCV DIR># make -j2

 It will take a while to complete the building. ( 30mins ~ 1hour )

 If you encounter 'undefined reference to symbol 'v4l2_munmap' ... libv4l2.so.0 : error adding symbols: DSO missing from command line' error while building OpenCV or OpenCV samples later, we need to add ‘-lv4l2’ after ‘-lv4l1’ in the corresponding configuration files. This error could happen for more than 50+ files so it’s better to add them all with a line of command instead.

root@edison:<OpenCV DIR># grep -rl -- -lv4l1 samples/* modules/* | xargs sed -i ‘s/-lv4l1/-lv4l1 -lv4l2/g’


 When building is done, install what is made by typing

 root@edison:<OpenCV DIR># make install


4. Making applications with OpenCV 3.0.0


 The easiest way to make a simple OpenCV application is using the sample came along with the package. Go to '<OpenCV DIR>/samples' and type

 root@edison:<OpenCV DIR>/samples# cmake .

 then it will configure and get ready to compile and link the samples. Now you can replace one of the sample code file in 'samples/cpp' and build it using cmake. For example, we can replace 'facedetect.cpp'  with our own code. Now at '<OpenCV DIR>/samples' type

 root@edison:<OpenCV DIR>/samples# make example_facedetect

 then it will automatically get the building done and output file will be placed in 'samples/cpp'

If you encounter 'undefined reference to symbol 'v4l2_munmap' ... libv4l2.so.0 : error adding symbols: DSO missing from command line' error while building OpenCV or OpenCV samples later, we need to add ‘-lv4l2’ after ‘-lv4l1’ in the corresponding configuration files. This error could happen for more than 50+ files so it’s better to add them all with a line of command instead.

root@edison:<OpenCV DIR># grep -rl -- -lv4l1 samples/* modules/* | xargs sed -i ‘s/-lv4l1/-lv4l1 -lv4l2/g’


One more thing, since Edison does not have a video out, an error will occur as you call functions related to 'display on the screen' such as 'imshow' which creates and displays an image or a video on the screen. Therefore, before you build samples or examples that include those functions, you need to comment them out. 


An Often Overlooked Game Performance Metric—Frame Time

$
0
0

Download PDF

As a quality assurance provider, Enzyme tests a large array of games on a weekly basis. When it comes to compatibility and performance testing, we have stumbled upon many instances where apparent performance hitches were not evident in the data collected during frame rate benchmarks.

The frame rate, or frames per second (FPS), while being a viable and simple method of measurement, is not the be-all and end-all data to consider when assessing performance. Another important metric to consider regarding frames is frame time.

Frame time mostly refers to the time it takes for the software to render each frame. More precisely, the data takes into consideration the duration of the benchmark multiplied by the average FPS of the application or rather, the total amount of frames rendered over the length of the benchmark rather than its duration in seconds. This data can be collected using benchmarking tools, such as the suite of Intel® INDE Graphic Performance Analyzers, and is crucial to take into account when assessing performance.

To illustrate this, consider a one-second frame time. If 60 frames are rendered during the first 500ms, followed by an absence of frames in the last 500ms of that second, the frame rate measure would still show an average of 60 FPS since the total number of frames displayed within that second is indeed 60.

While this case is unlikely, it demonstrates a worst-case scenario: a visible in-game hitch that is ignored by the frame rate data.

The frame time measurement provides more precise data as it keeps track of the time interval between every displayed frame. In the same case described above, a peak of 500ms will be easily and clearly identified when running the benchmark, allowing your team to troubleshoot the probable performance loss causes.

Small hitches in frames
Small hitches can be identified through the frame time and be completely ignored by the frame rate.

From a testing perspective, this type of data is often analyzed when comparing different hardware to identify the source of performances issues. We more often rely on the frame time than the frame rate as its linear nature makes it easier to analyze and is generally a more reliable source of information when it comes to a game's performances.

For instance, we have used frame time to compare performances with different storage devices. The following charts are representative of a situation where a clear difference is visible between an HDD and an SSD, yet can only be seen through frame time.

SSD&#039;s frame time
SSD's frame time is more stable than an HDD's. Frame rates are very similar for both.

Again, the performance issues are not represented in the FPS benchmark, whereas the frame time measurements clearly demonstrate an obvious increase in hitches on a system with an HDD compared to a system with an SSD. This type of comparison can prove to be useful for games that are heavy on texture streaming as we can determine if the type of storage device used causes a bottleneck.

In the end, FPS is a measurement that tends to even out the very short spikes. Frame time will catch everything; it might be a bit more intimidating to analyze since it contains a lot more data, but it is crucial to take it into account if you want to thoroughly troubleshoot and debug your software.

If you have questions on frame time measurement or would like to discuss other performance analysis best practices, don’t hesitate to contact us.

About the author
Enzyme was founded in 2002 by Yan Cyr and Emmanuel Viau, two pioneers in the video game industry. Using their international experience and the expertise of all the Enzymers, we have combined creativity and discipline in order to create Quality Assurance (QA) services and a testing methodology that add value to the clients’ products.

We are a passionate community dedicated to QA for video games, apps, software and websites. Whether you need QA testing, PC/Mobile compatibility testing, project evaluation or focus groups, or you are looking for localization or linguistic resources, or you need methodology or project management consultants, partnering with us will contribute to the achievement of your goals.

Our mission is to put our passionate workforce to use and contribute to the success of your projects.

Fast Gathering-based SpMxV for Linear Feature Extraction

$
0
0

1. Background

Sparse Matrix-Vector Multiplication (SpMxV) is a common linear algebra function that often appears in real recognition-related problems, such as speech recognition. In standard framework of speech/facial recognition, input data directly extracted from outside are not suitable for pattern matching. It is a must step to transform input data to more compact and amenable feature data by multiplying with a huge-scale constant sparse parameter matrix.

Figure 1: Linear Feature Extraction Equation

A matrix is characterized as sparse if most of its elements are zero. Density of matrix is defined as percentage of non-zero elements among the matrix, which varies from 0% to 50%. The basic idea on optimizing a SpMxV is to concentrate non-zero elements to avoid unnecessary multiple-with-zero operations as many as possible. In general, concentration methods can be classified as two kinds.

The first is the widely used Compressed Row Storage (CRS), which only store non-zero elements and their position information for each row. But it is so unfriendly to modern SIMD architecture that it is hardly vectorized with SIMD, and only outperforms SIMD-accelerated ordinary matrix-vector multiplication when matrix is extreme sparse. A variation of this means, tailored for SIMD implementation, is Blocked Compressed Row Storage (BCRS) in which a fixed-size block instead of an element is handled in the same way. Because of involvement of indirect memory access, its performance may degrade severely when matrix density increases.

The second is to reorder matrix row/column via permutation. The key of these algorithms is to find the best matrix permutation scheme measured by certain criterion correlated with non-zero concentration degree, such as:

  • Group non-zero elements together to facilitate partitioning matrix to sub-matrices
  • Minimize total count of continuous non-zeros N x 1 blocks

Figure 2:  Permutation to minimize N x 1 blocks

However, in some applications, such as speech/facial recognition, there exist some permutation-insensitive sparse matrices. That is to say that any permutation operation does not bring about significant improvement for SpMxV. An extremely simplified example matrix is:

Figure 3: Simplest permutation-insensitive matrix

If non-zero elements are uniformly distributed inside a sparse matrix, it may happen that when exchanging any two columns, rows benefitted are nearly same as rows negatively. When this situation happens, the matrix is permutation-insensitive.

Additionally, for those sparse matrices of somewhat high density, if no help can be expected from two methods, we have to resort to ordinary matrix-vector multiplication merely accelerated by SIMD instructions, illustrated in Figure 4, which is totally sparseness-unaware. In hopes of alleviating this problem, we initiated and generalized a gathering-based SpMxV algorithm that is effective for not only evenly distributed but also irregular constant sparse matrix.


2. Terms and Task

Before detailing the algorithm, we introduce some terms/definitions/assumptions to ease description.

  • A SIMD Block is a memory block that is same-sized as SIMD register. A SIMD BlockSet consists of one or several SIMD Blocks. A SIMD value is either a SIMD Block or a SIMD register, which can be a SIMD instruction operand.

  • An element is underlying basic data unit of SIMD value. Type of element can be built-in integer or float. Type of whole SIMD value is called SIMD type, and is vector of element types. Element index is element LSB order in the SIMD value, equal to element-offset/element-byte-size.

  • Instructions of loading a SIMD Block into a SIMD register are symbolized as SIMD_LOAD. For most element types, there are corresponding SIMD multiplication or multiplication-accumulation instructions. On X86, examples are PMADDUBSW/PMADDWD for integer, MULPS/MULPD for float. These instructions are symbolized as SIMD_MUL.

  • Angular bracket “< >” is used to indicate parameterization similar to C++ template.

  • For a value X in memory or register, X<L>[i] is the ith L-bit slice of X, in LSB order.

On modern SIMD processors, an ordinary matrix-vector multiplication can be greatly accelerated with the help of SIMD instructions as the following pseudo-code:

Figure 4: Plain Matrix-Vector SIMD Multiplication

In the case of sparse matrix, we propose an innovative technique to compact non-zeros of the matrix, while sustaining SpMxV’s implementability via SIMD ISA as above pseudo-code, with a goal of reducing unnecessary SIMD_MUL instructions. Since a matrix is assumed to be constant, the operation of compacting non-zeros is considered as preprocessing on the matrix, which can be completed during program initialization or off-line matrix data preparation, so that no runtime cost is incurred for a matrix-vector multiplication.


3. Description

GATHER Operation

First of all, we should define a conceptual GATHER operation, which is the basis of this work. And its general description is:

GATHER<T, K>(destination = [D0, D1, …, DE–1],
                           source       = [S0, S1, …, SK*E–1],
                           hint            = [H0, H1, …, HE–1])

The parameters destination and source are SIMD values, whose SIMD type is specified by T. And destination is one SIMD value whose element count is denoted by E, while source consists K SIMD value(s) whose total element count is K*E. The parameter hint, called Relocation Hint, has E integer values, each of which is called Relocation Index. A Relocation Index is derived from a virtual index ranging between –1 and K*E–1, and can be described by a mathematical mapping as:    

 RELOCATION_INDEX<T>(index), abbreviated as RI<T>(index)

GATHER operation will move elements of source into destination based on Relocation Indices as:

  • If Hi is RI<T>(–1), GATHER will retain context of Di.
  • If Hi is RI<T>(j) (0 ≤ j < K*E), GATHER will move Sj to Di.

Implementation of GATHER operation is specific to processor’s ISA. Correspondingly, RI mapping depends on instruction selection for GATHER. Likewise, materialization of hint may be a SIMD value or an integer array, or even mixed with other Relocation Hints, which is totally instruction-specific.

According to ISA availability of certain SIMD processor, we only consider those, called fast or intrinsic GATHER operation, which can be translated to simple and efficient instruction sequence with low CPU cycles.


Fast GATHER on X86

On X86 processor, we propose a method to construct fast GATHER using BLEND and SHUFFLE instruction pair.

Given a SIMD type T, imagined BLEND and SHUFFLE instruction are defined as:

  • BLEND<T, L>(operand1, operand2,mask)  ->  result

    L is power of 2, not more than element bit length of T. And operand1, operand2 and result are values of T; mask is a SIMD value whose element is L-bit integer, and its element count is denoted by E. For the ith (0 ≤ i < E) element of mask, we have:

    • operand1<L>[i]  ->  result<L>[i]      (if the element’s MSB is 0)
    • operand2<L>[i]  ->  result<L>[i]      (if the element’s MSB is 1)
  • SHUFFLE<T, L>(operand1, mask)  ->  result

    Parameters description is same as BLEND. In element of mask, only low log2(E) bits, called SHUFFLE INDEX BITS, and MSB are significant. For the ith (0 ≤ i < E) element of mask, we have:

    • operand1<L>[mask<L>[i] & (E–1) ]  ->  result<L>[i]          (if the element’s MSB is 0)
    • instruction specific value  ->  result<L>[i]                          (if the element’s MSB is 1)

Then, we will construct fast GATHER<T, K> using SHUFFLE<T, LS> and BLEND<T, LB> instruction pair.  And element bit length of T is denoted by LT, SHUFFLE INDEX BITS is SIB. Relocation Hint is materialized as one SIMD value and each Relocation Index is LT-bit integer. The mathematical mapping RI<T>( ) is defined as:

  • RI<T>(­virtual index = –1) = –1

  • If virtual index ≥ 0, in other words, we can suppose the element indicated by this index is actually the pth element of the kth (0 ≤ k < K) source SIMD value. Final result, denoted by rid, is computed according to the formulations:

    • LS ≤ LB   (0 ≤ i < LT/LS)
      rid< LS>[i] = k * 2SIB + p * LT/LS + i                    ( i = integer * LB/LS – 1)
      rid< LS>[i] = ? * 2SIB + p * LT/LS + i                    ( i ≠ integer * LB/LS – 1)


    • LS > LB   (0 ≤ i < LT/LB)
      rid< LB>[i] = k * 2SIB + p * LT/LS + i * LB/LS       ( i = integer * LS/LB)
      rid< LB>[i] = k * 2SIB + ? & (2SIB– 1)                   ( i ≠ integer * LS/LB)

 Figure 5 is an example illustrating Relocation Hint for a GATHER<8*int16, 2> while LS = LB = 8.

Figure 5:  Relocation Hint For Gathering 2 SSE Blocks

The code sequence of fast GATHER<T, K> is depicted in Figure 6. Destination and Relocation Hint are symbolized as D and H. Source values are represented by B0, B1, …, BK–1. Besides, an essential SIMD constant I, of which element bit length is min(LS, LB) and each element is the integer 2SIB, will be used. Additionally, a condition should be satisfied that K is not more than 2min(LS, LB) – SIB – 1, which is K ≤ 8 for above case.

Figure 6:  Fast GATHER Code Sequence

Depending on SIMD type and processor SIMD ISA, SHUFFLE and BLEND should be mapped to specific instructions as optimal as possible. Some existing instruction selections are listed as examples.

SSE128 - Integer

PSHUFB + PBLENDV

LS=8,   LB=8

SSE128 - Float

VPERMILPS + BLENDPS

LS=32, LB=32

SSE128 - Double

VPERMILPD + BLENDPD

LS=64, LB=64

AVX256 - Int32/64

VPERMD + PBLENDV

LS=32, LB=8

AVX256 - Float

VPERMPS + BLENDPS

LS=32, LB=32


Sparse Matrix Re-organization

In a SpMxV, two operands, the matrix and the vector, are expressed by M and V respectively. Each row in M is partitioned into several pieces in unit of SIMD Block according to certain scheme. Non-zero elements in a piece are compacted into one SIMD Block as many as possible. If there are some remaining non-zero elements outside of compaction, the piece’s SIMD Blocks containing them should be as least as possible. Meanwhile, these leftover elements are moved to a left-over matrix ML. Obviously, M*V is theoretically broken up to (M–ML)*V and ML*V. When a proper partition scheme is adopted, especially possible for those nearly even distributed sparse matrices, ML is intended to be an ultra sparse matrix that is far sparser than M so that computation time of ML*V is non-significant in total time. We can apply standard compression-based algorithm or like, which will not be covered in this invention, to ML*V. And organization of ML is subject to its multiplication algorithm and its storage is separate from M’s compacted data, whose organization is detailed as the following.

Given a piece, suppose it contains N+1 SIMD Blocks of type T, expressed by MB0, MB1, …, MBN. We use MB0 as containing Block, select and gather non-zero elements of the other N Blocks into MB0. Without loss of generality, we assume that this gathering-N-Block operation is synthesized from one or several intrinsic GATHERs, whose ‘K’ parameters are K1, K2, …, KG that are subject to N = K1 + K2 + … + KG. That is to say, the N Blocks are divided into G groups sized by K1, K2, …, KG, and these groups are individually gathered into MB0 one by one. To archive best performance, we should find a decomposition that minimizes G. This is a classical knapsack type problem and can be solved in either dynamic programming or greedy method. As a special case, when intrinsic GATHER<T, N> exists, G=1.

Relocation Hints for those G intrinsic GATHERs are expressed by MH1, MH2, …, MHG. So, the piece will be replaced with its compacted form consisting of two parts: MB0 after compaction and (MH1, MH2, …, MHG). The former is called Data Block. The latter is called Relocation Block and means certain possible combination form of all Relocation Hints, which is specific to any implementation or optimization consideration that is out of discussion of this paper. The combination form may be affected by alignment enforcement, memory optimization, or other instruction-specific reasons. For example, if a Relocation Index occupies only half a byte, we can merge two Relocation Indices from two Relocation Hints into one byte so as to reduce memory usage. Ordinarily, a simple way is to layout Relocation Hints end to end. Figure 5 also shows how to create Data Block and Relocation Block for a 3-Block piece. A blank in SIMD Block means zero-valued element.


Sparse Matrix Partitioning Scheme

To guide decision on how to partition a row of matrix, we introduce a cost model. For a piece of N+1 SIMD Blocks, suppose that there will be R (R ≤ N) SIMD Blocks containing non-zero elements to be moved to ML. The cost of this piece is 1 + N*CostG + R*(1+CostL), in which:

In the following description, one or several adjacent pieces in a row will be referred as a whole, which is termed piece clique. All rows of the matrix have same partitioning scheme as:

  • 1 is cost of a SIMD multiplication in the piece.
  • CostG (CostG < 1) means cost of gathering one SIMD Block.
  • CostL means extra effort for a SIMD multiplication in ML, is always a very small value.

In the following description, one or several adjacent pieces in a row will be referred as a whole, which is termed piece clique. All rows of the matrix have same partitioning scheme as:

  • Row is cut into identical primary cliques except a possible leftover clique with fewer pieces than primary one.
  • Pieces in any clique should be not more than a pre-defined count limit C(1≤ C), which is statically deduced from characteristic of non-zero distribution of the sparse matrix and is also used to control code complexity in final implementation.
  • Total cost of all pieces in the matrix should be minimal for the given count limit C. As to how to find this most optimal scheme, we may rely on an exhaustive search or an improved beam algorithm. This beam algorithm will be covered in a new patent and ignored here.

An example of partitioning is [4, 5, 2], [4, 5, 2], [4, 5, 2], [2, 5] for a 40-Block row when C=3. ‘[ ]’ means a piece clique. For those even-distributed matrices, C=1 is always chosen.


Gather-Based Matrix-Vector Multiplication

Multiplication between vector V and a row of M is broken up into sub-multiplications on partitioned pieces. Given a piece in M, which we suppose its original form has N+1 SIMD Blocks, the corresponding SIMD Blocks in vector V are expressed by VB0, VB1, …, VBN. Previous symbol definitions for piece are extended to this section.

With new compacted form, a piece multiplication between [MB0, MB1, …, MBN] and [VB0, VB1, …, VBN] is transformed to operations of gathering effective vector elements into VB0 and only one SIMD multiplication on Data Block and VB0. Figure 7 depicts the pseudo-code of new multiplication, in which Data Block is MD, Relocation Block is MR and the vector is VB. And we will refer to a conceptual function EXTRACT_HINT(MR, i) (1 ≤ i ≤ G), which means extracting the ith Relocation Hint from MR and is the reverse operation to aforementioned ₡(MH1, MH2, …, MHG). To improve performance, there may be some internal temporaries inside this function. For example, register value of previous Relocation Hint was retained to avoid memory access. But detail of this function is not in scope of the article.

Figure 7:  Multiplication For Compacted Form of N+1 SIMD Blocks

In the code, original N SIMD multiplications are replaced by G gathering operations. Therefore, computation acceleration is possible and meaningful only if the former is much more time-consuming than the latter. We should compose efficient intrinsic GATHER to guarantee this assertion. This matter is easily done for some processors, such as ARM, on which intrinsic GATHER of SIMD integer type can be directly mapped to single low-cost hardware instruction. To be more specific, the fast GATHER elaborately constructed on X86 also satisfies the assertion. For the ith (1 ≤ i ≤ G) SIMD Block group in the piece, Ki SIMD_MULs are replaced by Ki rather faster BLEND and SHUFFLE pairs, and Ki1 SIMD_LOADs from the matrix are avoided and replaced by Ki1 much more CPU-cycle-saving SIMD_SUBs.

At last, new SpMxV algorithm can be described by the following flowchart:

Figure 8:  New Sparse Matrix-Vector Multiplication


4. Summary

The algorithm can be used to improve sparse matrix-vector and matrix-matrix multiplication in any numerical computation. As we know, there are lots of applications involving semi-sparse matrix computation in High Performance Computing. Additionally, in popular perceptual computing low-level engines, especially speech and facial recognition, semi-sparse matrices are found to be very common. Therefore, this invention can be applied to those mathematical libraries dedicated to these kinds of recognition engines.

Debugging Intel® Xeon Phi™ Applications on Windows* Host

$
0
0

Contents

Introduction

Intel® Xeon Phi™ coprocessor is a product based on the Intel® Many Integrated Core Architecture (Intel® MIC). Intel® offers a debug solution for this architecture that can debug applications running on an Intel® Xeon Phi™ coprocessor.

There are many reasons for the need of a debug solution for Intel® MIC. Some of the most important ones are the following:

  • Developing native Intel® MIC applications is as easy as for IA-32 or Intel® 64 hosts. In most cases they just need to be cross-compiled (/Qmic).
    Yet, Intel® MIC Architecture is different to host architecture. Those differences could unveil existing issues. Also, incorrect tuning for Intel® MIC could introduce new issues (e.g. alignment of data, can an application handle more than hundreds of threads?, efficient memory consumption?, etc.)
  • Developing offload enabled applications induces more complexity as host and coprocessor share workload.
  • General lower level analysis, tracing execution paths, learning the instruction set of Intel® MIC Architecture, …

Debug Solution for Intel® MIC

For Windows* host, Intel offers a debug solution, the Intel® Debugger Extension for Intel® MIC Architecture Applications. It supports debugging offload enabled application as well as native Intel® MIC applications running on the Intel® Xeon Phi™ coprocessor.

How to get it?

To obtain Intel® Debugger Extension for Intel® MIC Architecture on Windows* host, you need the following:

Debug Solution as Integration

Debug solution from Intel® based on GNU* GDB:

  • Full integration into Microsoft Visual Studio*, no command line version needed
  • Available with Intel® Composer XE 2013 SP1 and later
    (Intel® Parallel Studio XE Composer Edition is the successor)

Note:
Pure native debugging on the coprocessor is also possible by using Intel’s version of GNU* GDB for the coprocessor. This is covered in the following article for Linux* host:
http://software.intel.com/en-us/articles/debugging-intel-xeon-phi-applications-on-linux-host

Why integration into Microsoft Visual Studio*?

  • Microsoft Visual Studio* is established IDE on Windows* host
  • Integration reuses existing usability and features
  • Fortran support added with Intel® Parallel Studio XE Composer Edition for Fortran (former Intel® Fortran Composer XE)

Components Required

The following components are required to develop and debug for Intel® MIC Architecture:

  • Intel® Xeon Phi™ coprocessor
  • Windows* Server 2008 RC2, Windows* 7 or later
  • Microsoft Visual Studio* 2012 or later
    Support for Microsoft Visual Studio* 2013 was added with Intel® Composer XE 2013 SP1 Update 1. Microsoft Visual Studio* 2015 is supported with Intel® Parallel Studio XE 2016 Composer Edition and Intel® Parallel Studio XE 2015 Composer Edition Update 4, and later.
  • Intel® MPSS 3.1 or later
  • C/C++ development:
    Intel® C++ Composer XE 2013 SP1 for Windows* or later
  • Fortran development:
    Intel® Fortran Composer XE 2013 SP1 for Windows* or later

Configure & Test

It is crucial to make sure that the coprocessor setup is correctly working. Otherwise the debugger might not be fully functional.

Setup Intel® MPSS:

  • Follow Intel® MPSS readme-windows.pdf for setup
  • Verify that the Intel® Xeon Phi™ coprocessor is running

Before debugging applications with offload extensions:

  • Use official examples from:
    C:\Program Files (x86)\IntelSWTools\samples_2016\en
  • Verify that offloading code works

It is crucial to make sure that the coprocessor setup is correctly working. Otherwise the debugger might not be fully functional.

Prerequisite for Debugging

Debugger integration for Intel® MIC Architecture only works when debug information is being available:

  • Compile in debug mode with at least the following option set:
    /Zi (compiler) and /DEBUG (linker)
  • Optional: Unoptimized code (/Od) makes debugging easier
    (due to removed/optimized away temporaries, etc.)
    Visual Studio* Project Properties (Debug Information &amp;amp;amp;amp;amp;amp;amp;amp;amp;amp;amp;amp;amp;amp;amp;amp;amp;amp;amp;amp;amp; Optimization)

Applications can only be debugged in 64 bit

  • Set platform to x64
  • Verify that /MACHINE:x64 (linker) is set!
    Visual Studio* Project Properties (Machine)

Debugging Applications with Offload Extension

Start Microsoft Visual Studio* IDE and open or create an Intel® Xeon Phi™ project with offload extensions. Examples can be found in the Samples directory of Intel® Parallel Studio XE Composer Edition (former Intel® Composer XE), that is:

C:\Program Files (x86)\IntelSWTools\samples_2016\en

  • compiler_c\psxe\mic_samples.zip or
  • compiler_f\psxe\mic_samples.zip

We’ll use intro_SampleC from the official C++ examples in the following.

Compile the project with Intel® C++/Fortran Compiler.

Characteristics of Debugging

  • Set breakpoints in code (during or before debug session):
    • In code mixed for host and coprocessor
    • Debugger integration automatically dispatches between host/coprocessor
  • Run control is the same as for native applications:
    • Run/Continue
    • Stop/Interrupt
    • etc.
  • Offloaded code stops execution (offloading thread) on host
  • Offloaded code is executed on coprocessor in another thread
  • IDE shows host/coprocessor information at the same time:
    • Breakpoints
    • Threads
    • Processes/Modules
    • etc.
  • Multiple coprocessors are supported:
    • Data shown is mixed:
      Keep in mind the different processes and address spaces
    • No further configuration needed:
      Debug as you go!

Setting Breakpoints

Debugging Applications with Offload Extension - Setting Breakpoints

Note the mixed breakpoints here:
The ones set in the normal code (not offloaded) apply to the host. Breakpoints on offloaded code apply to the respective coprocessor(s) only.
The Breakpoints window shows all breakpoints (host & coprocessor(s)).

Start Debugging

Start debugging as usual via menu (shown) or <F5> key:
Debugging Applications with Offload Extension - Start Debugging

While debugging, continue till you reach a set breakpoint in offloaded code to debug the coprocessor code.

Thread Information

Debugging Applications with Offload Extension - Thread Information

Information of host and coprocessor(s) is mixed. In the example above, the threads window shows two processes with their threads. One process comes from the host, which does the offload. The other one is the process hosting and executing the offloaded code, one for each coprocessor.

Additional Requirements

For debugging offload enabled applications additional environment variables need to be set:

  • Intel® MPSS 2.1:
    COI_SEP_DISABLE=FALSE
    MYO_WATCHDOG_MONITOR=-1

     
  • Intel® MPSS 3.*:
    AMPLXE_COI_DEBUG_SUPPORT=TRUE
    MYO_WATCHDOG_MONITOR=-1

Set those variables before starting Visual Studio* IDE!

Those are currently needed but might become obsolete in the future. Please be aware that the debugger cannot and should not be used in combination with Intel® VTune™ Amplifier XE. Hence disabling SEP (as part of Intel® VTune™ Amplifier XE) is valid. The watchdog monitor must be disabled because a debugger can stop execution for an unspecified amount of time. Hence the system watchdog might assume that a debugged application, if not reacting anymore, is dead and will terminate it. For debugging we do not want that.

Note:
Do not set those variables for a production system!

Debugging Native Coprocessor Applications

Pre-Requisites

Create a native Intel® Xeon Phi™ coprocessor application and transfer & execute the application to the coprocessor target:

  • Use micnativeloadex.exe provided by Intel® MPSS for an application C:\Temp\mic-examples\bin\myApp, e.g.:

    > "C:\Program Files\Intel\MPSS\bin\micnativeloadex.exe""C:\Temp\mic-examples\bin\myApp" -d 0
  • Option –d 0 specifies the first device (zero based) in case there are multiple coprocessors per system
  • The application is executed directly after transfer

micnativeloadex.exe transfers the specified application to the specified coprocessor and directly executes it. The command itself will be blocked until the transferred application terminates.
Using micnativeloadex.exe also takes care about dependencies (i.e. libraries) and transfers them, too.

Other ways to transfer and execute native applications are also possible (but more complex):

  • SSH/SCP
  • NFS
  • FTP
  • etc.

Debugging native applications with Start Visual Studio* IDE is only possible via Attach to Process…:

  • micnativeloadex.exe has been used to transfer and execute the native application
  • Make sure the application waits till attached, e.g. by:
    
    		static int lockit = 1;
    
    		while(lockit) { sleep(1); }
    
    		
  • After having attached, set lockit to 0 and continue.
  • No Visual Studio* solution/project is required.

Only one coprocessor at a time can be debugged this way.

Configuration

Open the options via TOOLS/Options… menu:Debugging Native Coprocessor Applications - Configuration

It tells the debugger extension where to find the binary and sources. This needs to be changed every time a different coprocessor native application is being debugged.

The entry solib-search-path directories works the same as for the analogous GNU* GDB command. It allows to map paths from the build system to the host system running the debugger.

The entry Host Cache Directory is used for caching symbol files. It can speed up lookup for big sized applications.

Attach

Open the options via TOOLS/Attach to Process… menu:Debugging Native Coprocessor Applications - Attach to Process...

Specify the Intel(R) Debugger Extension for Intel(R) MIC Architecture. Set the IP and port the GDBServer should be executed with. The usual port for GDBServer is 2000 but we recommend to use a non-privileged port (e.g. 16000).
After a short delay the processes of the coprocessor card are listed. Select one to attach.

Note:
Checkbox Show processes from all users does not have a function for the coprocessor as user accounts cannot be mapped from host to target and vice versa (Linux* vs. Windows*).

Documentation

More information can be found in the official documentation from Intel® Parallel Studio XE Composer Edition:
C:\Program Files (x86)\IntelSWTools\documentation_2016\en\debugger\ps2016\get_started.htm

What's New? Intel® Advisor XE 2016

$
0
0


Intel Advisor XE 2016 is a successor product to Intel® Advisor XE 2015. Intel Advisor XE 2016 provides a set of tools that help you decide where to add threading and vectorization to your applications. The key features provided by this new major version since the Intel Advisor XE 2015 release include:

  • Vectorization assistance in addition to the threading assistance available in the previous product
  • Significant changes to the product workflow because of the addition of vectorization assistance

What's new? - Intel® Inspector XE 2016

$
0
0

Intel® Inspector XE 2016 is a successor product to Intel® Inspector XE 2015. Intel Inspector XE 2016 provides a set of tools that help you verify the correctness of your application. It includes support for both memory and thread checking. The key features provided by this new major version since the Intel Inspector XE 2015 release include:

  • Added new OS support.

What’s new in Visual Studio 2015? – Part I: IDE and C#

$
0
0

Every time that there is a new version of Visual Studio I’m very keen to learn and implement the most relevant features. The problem is that the documentation that I’ve found is too low level (i.e.: lots of details) or too light. So I decided to create a series of posts exploring  all that is new regarding VS, C# and ASP.Net while maintaining the balance between don’t say a thing and don’t say too much.

This new version of Visual Studio includes several new features and improvements. Developers will find plenty of options to develop for iOS, Android and Windows devices. Some of them are described as follows:

  • Xamarin for Visual Studio is the tool to develop/debug native apps for any device.
  • Apache Cordova with Visual Studio is the tool to build (and debug) cross-platform native applications using HTML, CSS, JavaScript and Typescript.
  • Cross-platform native development/debugging via Visual C++.
  • Cross-platform games development with Unity.
  • Universal Windows apps to target different Windows 10 devices (xBox, HoloLens, IoT, etc).
  • New compiler (Roslyn) is faster but more importantly exposes an API to analyse/generate code. Thanks to Roslyn is possible to find issues in your code as you type.
  • Other improvements in the IDE like performance tips (to check the execution time per function – you definitely will notice this new floating window!), a wizard to connect your app to backend services (incl. Azure Mobile Services, Azure Storage, Salesforce and Office 365), new breakpoint settings, graphic diagnostics for DirectX apps, edition history in CodeLens and sign-in with multiple accounts.

Say hello to C# 6!

Do you remember C# v1 back in 2002? Well, developers were presented with new language features version after version and C# 6 isn’t the exception. Off the top of my head the most important changes in C# during all these years were generics (C# 2 VS2005), automatic properties/Linq/lambda expressions (C# 3 VS2008) and async/await (C# 5 VS 2010) among others. Now for C# 6 I’m happy to describe some of the most relevant features as follows:

    • New keyword nameof to get the string name of a variable
    • String interpolation: if a picture is worth of 1000 word, a piece of code might be worth 1000’s pictures (by the way, don’t you think that the name of this feature sounds very pro?)
1
2
3
4
5
// Before
stringtwitterHandle = "jacace";
System.Console.WriteLine(String.Format("My twitter handle is: {0} ", twitterHandle));
// Now in C# 6.0
System.Console.WriteLine($"My twitter handle is: {twitterHandle}");
    • Null conditional operator.
    • Collection initializers.
    • Exception filters:
1
2
3
4
5
6
7
8
stringstr = null;
try
{
    Console.WriteLine(str.Length);
} catch(NullReferenceException e) when (e.Source == nameof(Main))
{
 
}
  • Function member bodies with lambda expressions: in the following image the body of the function GetPersonalBlogUrl is defined as a lambda expression (without a return statement).

vs2015_static

  • Use of static functions as local members: as illustrated in the previous image, a static function from another class can be used locally with the using statement. This saves you two lines of code: one to import the external namespace and another one (or part of it) containing the class name.

Thanks for reading. Please remember that my descriptions and observations don’t cover every single aspect of the new features but what I think I’ll use myself. Next post will cover the .Net Framework 4.6.

Javier Andrés Cáceres Alvis

Microsoft Most Valuable Professional – MVP

Intel Black Belt Software Developer

[ also published in my personal blog: https://jacace.wordpress.com/2015/08/17/whats-new-in-visual-studio-2015-part-i-ide-and-c/ ]

Intel® RealSense™ Depth Camera R200 Code Sample – Face Tracking

$
0
0

Download R200 Camera Face Tracking Code Sample

Introduction

This C#/XAML code sample demonstrates the basics of using the face tracking algorithm in the Intel® RealSense™ SDK for Windows* to detect and track a person’s face in real time using the R200 camera. The code sample performs the following functions:

  • Displays the live color stream of the R200 RGB camera in an Image control
  • Superimposes a rectangle control that tracks the user’s face (based on his or her appearance in the scene)
  • Displays the number of faces detected by the R200 camera
  • Displays the height and width of the tracked face
  • Displays the 2D coordinates (X and Y) of the tracked face
  • Indicates the face depth or distance between the face and the R200 camera
  • Enables and displays alert monitoring and subscribes to an alert event handler

Face Tracking Code Sample
Figure 1. Face Tracking Code Sample

Software Development Environment

The code sample is created on Windows® 10 RTM using Microsoft Visual Studio* Community 2015. The project template used for this sample is Visual C#WindowsClassic Desktop.

The SDK and DCM versions used in this project are:

  • Intel® RealSense™ SDK                                                       v6.0.21.6598
  • Intel® RealSense™ Depth Camera Manager R200              v2.0.3.39488

Hardware Overview

For this development work we used the Intel® RealSense™ Developer Kit (R200) with the camera mounted to a standard tripod using an optional magnetic mount** (Figure 2).

Camera Attached to Optional Magnetic Mount
Figure 2. Camera Attached to Optional Magnetic Mount**

(**May not be available in all kits.)

The basic hardware requirements for running the R200 code sample are as follows:

  • 4th generation (or later) Intel® Core™ processor
  • 150 MB free hard disk space
  • 4GB RAM
  • Intel® RealSense™ camera (R200)
  • Available USB3 port for the R200 camera (or dedicated connection for integrated camera)

Important Note: A USB3 interface is required to support the bandwidth needed by the camera. This interface must be connected to a dedicated USB3 port in the client system (do not use a hub).


Build Notes

  1. The project uses the System.Drawing.Imaging namespace, which is referenced manually in a new project by right-clicking References in Solution Explorer and then selecting Add Reference… to open the Reference Manager window. Next, select Assemblies, Framework and then search the list for System.Drawing. Highlight the checkbox and then click the OK button.
  2. The project uses an explicit path to libpxcclr.cs.dll (the managed DLL) located here: C:\Program Files (x86)\Intel\RSSDK\bin\x64. You will need to change this reference if your SDK installation path is different.
  3. Since this project is referencing the 64-bit version of the DLL, you must ensure that “x64” is specified under the ProjectPropertiesPlatform target setting.
  4. The project includes a post-build event command to ensure the unmanaged DLL (libpxccpp2c.dll) gets copied to the output target directory:
    if "$(Platform)" == "x86" (copy /y "$(RSSDK_DIR)\bin\win32\libpxccpp2c.dll""$(TargetDir)" ) else ( copy /y "$(RSSDK_DIR)\bin\x64\libpxccpp2c.dll""$(TargetDir)" )

About the Code

The code sample has the following structure:

  • Configure the Session, SenseManager interface, and face module.
  • Start a worker thread named Update, in which the AcquireFrame-ReleaseFrame loop is processed.
  • The following actions take place inside the AcquireFrame-ReleaseFrame loop:
    • Get image data.
    • Get face module data.
    • Call the Render method to update the UI.
    • Release resources.
    • Release the frame.
  • The following actions take place inside the Render method:
    • Call the ConvertBitmap method to convert each bitmap frame to a BitmapImage type, which is required for displaying each frame in the WPF Image control.
    • Update the UI by delegating work to the Dispatcher associated with the UI thread.
  • A ShutDown method is called whenever the Window_Closing or btnExit_Click events fire. The following actions take place inside the ShutDown method:
    • Stop the Update thread.
    • Dispose objects.

Check It Out

Follow the Download link to get the code and experiment with this sample.

About Intel® RealSense™ Technology

To get started and learn more about the Intel RealSense SDK for Windows, go to https://software.intel.com/en-us/intel-realsense-sdk.

About the Author

Bryan Brown is a software applications engineer in the Developer Relations Division at Intel. 


Intel® RealSense™ Depth Camera Code Sample – R200 Camera Streams

$
0
0

Download R200 Camera Streams Code Sample

Introduction

This downloadable code sample demonstrates the basics of capturing and viewing raw R200 camera streams in C#/XAML using the Intel® RealSense™ SDK for Windows*. The Visual Studio* solution is actually comprised of four simple projects (each under 200 lines of code):

  • ColorStream– Displays the color stream from the RGB camera
  • DepthStream– Displays the depth stream
  • IRStreams– Displays the left and right IR camera streams
  • AllStreams– Shows all of the above in a single window (Figure 1)

All Streams Code Sample
Figure 1. All Streams Code Sample


Software Development Environment

The code sample was created on Windows® 10 RTM using Microsoft Visual Studio Community 2015. The project template used for this sample is Visual C#WindowsClassic Desktop.

The SDK and DCM versions used in this project are:

  • Intel® RealSense™ SDK                                                       v6.0.21.6598
  • Intel® RealSense™ Depth Camera Manager R200              v2.0.3.39488

Hardware Overview

For this development work we used the Intel® RealSense™ Developer Kit (R200), which includes the camera, USB3 cable, and a magnetic adhesive mount for attaching the camera to a laptop computer (Figure 2).

Intel® RealSense™ Developer Kit (R200)
Figure 2. Intel® RealSense™ Developer Kit (R200)

The hardware requirements for running the R200 code sample are as follows:

  • 4th generation (or later) Intel® Core™ processor
  • 150 MB free hard disk space
  • 4GB RAM
  • Intel® RealSense™ camera (R200)
  • Available USB3 port for the R200 camera (or dedicated connection for integrated camera)

Important Note: A USB3 interface is required to support the bandwidth needed by the camera. This interface must be connected to a dedicated USB3 port within the client system (do not use a hub).


About the Code

The Visual Studio solution consists of four WPF projects developed in C#. These projects use an explicit path to libpxcclr.cs.dll (the managed DLL):

C:\Program Files (x86)\Intel\RSSDK\bin\x64

Note that this reference will need to be changed if your SDK installation path is different.

Since we are referencing the 64-bit version of the DLL, you must also ensure that “x64” is specified under the ProjectPropertiesPlatform target setting.

To build and run a particular project, right-click on the project name (e.g., AllStreams) in Solution Explorer, then select Set as StartUp Project from the menu options.

All of the projects contained in the CameraStreams solution have a similar structure:

  • Configure the Session and SenseManager interface.
  • Start a worker thread named Update, in which the AcquireFrame-ReleaseFrame loop is processed.
  • The following actions take place inside the AcquireFrame-ReleaseFrame loop:
    • Get image data.
    • Call the Render method to update the UI.
    • Release resources.
    • Release the frame.
  • The following actions take place inside the Render method:
    • Call the ConvertBitmap method to convert each bitmap frame to a BitmapImage type, which is required for displaying each frame in the WPF Image control.
    • Update the UI by delegating work to the Dispatcher associated with the UI thread.
  • A ShutDown method is called whenever the Window_Closing or btnExit_Click events fire. The following actions take place inside the ShutDown method:
    • Stop the Update thread.
    • Dispose objects.

Check It Out

Follow the Download link to get the code and experiment with this sample.

About Intel® RealSense™ Technology

To get started and learn more about the Intel RealSense SDK for Windows, go to https://software.intel.com/en-us/intel-realsense-sdk.

About the Author

Bryan Brown is a software applications engineer in the Developer Relations Division at Intel. 

Use VTune amplifier system 2016 for HelloOpenCL GPU application analysis

$
0
0

Prerequisite:

You are recommended to learn how to use VTune to perform a profiling first before reading this article. If you don’t know how to do it, you may refer the tutorial documents first to understand basics in VTune.

Introduction

VTune Amplifier 2016 for system can be also used to analyze OpenCL™ programs. This article is to show you how to use this function and also to create a simple OpenCL program HelloOpenCL via Microsoft Visual Studio & Intel OpenCL codebuilder.

OpenCL is an open standard designed to do portable parallel programming on heterogeneous systems, for example, the system having CPUs, GPUs, DSPs, FPGA and other hardware devices. An OpenCL application contains mainly two implementations. 1) host APIs codes and 2) devices program codes, what we called devices kernel code. Host APIs contains two kind of APIs. The platform APIs are to check available devices regarding platform capability, to select and initialize OpenCL devices. And runtime APIs are used to set and execute kernels on selected devices. To develop devices kernel codes executed on the OpenCL runtime, you can use Intel OpenCL codebuilder IDE. Different hardware vendors have their own OpenCL runtime implementation. Therefore, you have to make sure the required runtime implementation was installed.

VTune openCL analysis support can help identify which hotspot kernels spending most time and how often the kernels are invoked. Furthermore, copying data between different HW devices also takes time because it results in HW contexts switch. In VTune, certain OpenCL memory read/write bandwidth metrics can also help investigate possible stalls caused by memory accessing. In the following sections, we will show you how to create a simple HelloOpenCL program and also how to use the VTune OpenCL analysis with the new  architecture diagram feature..

Start the first OpenCL GPU program – HelloOpenCL.

Before starting to develop the HelloOpenCL program, you have to download a few things. To build a kernel code and check platform capability, you can download OpenCL code builder which is contained in INDE package. Secondly, the OpenCL runtime implementation is required to be installed on target device. Intel OpenCL implementation is included in Intel graphics package. You can download the driver from here. Visit this to get more downloading options and instructions.

After installed OpenCL codebuilder, you can check what kind of OpenCL devices it will support. This test target machine is based on 4th Generation Intel® Core™ Processors for client systems and the codename is Haswell.

After confirmed your environment had OpenCL devices support like the above figure shows, you can use Microsoft Visual Studio Professional 2013 to create your first OpenCL program by using installed template, HelloOpenCL or directly use this sample code we included in this KB. This sample codes request GPU device to perform math addition for two 2-dimension buffers and produce a 2-dimension output buffers. This can be applied for the typical image filter application. Here is the HelloOpenCL sample codes.DownloadDownload

Profiling HelloOpenCL with VTune Amplifier system 2016

With the HelloOpenCL program being built up successfully, VTune can be directly lunched to perform the application profiling in Visual Studio IDE. Check the detailed setup steps in the following figure to setup OpenCL GPU profiling in VTune.

  1. Lunch the VTune in VS 2013 IDE
  2. Choose the advanced hotspots analysis type
  3. Choose graphics hardware events of memory accesses
  4. Check the OpenCL programs option.

After successfully collected VTune logs, you should be able to see the VTune’s analysis timeline view below by switching to the Graphics tab. Check the following indexes for functions brief.

  1. VTune contains several grouping views of functions calls list. For openCL GPU program, the specific grouping views “Computing Task Purpose/*” is provided in order to better explain the OpenCL APIs efficiency with OpenCL-aware metrics.
  2. These annotations are used to describe OpenCL’s host API codes running on CPU side. They also can present how long CPU running time one task function occupies. For details, clBuildProgram is to interpret kernel codes into the program which can be executed on OpenCL runtime implementation. clCreateKernel is to choose one kernel function in previous built OpenCL program which can contain multiple kernel functions. clEnqueueNDRange is put certain kernel function into an OpenCL command queue which will be picked up and executed by GPU.
  3. This “Intel(R) HD Graphics 4…” timeline shows that "Add” is the kernel function scheduled on Intel GPU runtime implementation.
  4. It highlighted when the real GPU activity of “Add” occurs at on GPU HW. From the timing kernel function is scheduled to the timing the kernel function is really executed, there is a time delay caused by certain preparation and context switching.
  5. This is the new feature provided in the latest VTune Amplifier 2016. Like what the following figure shows, it illustrates data transfer efficiency with statistic data form and presents bandwidth data in general GPU architecture diagram. Untyped memory read bandwidth is twice write bandwidth and that matches HelloOpenCL application’s behavior.

From this architecture diagram, you can also observe the buffers used in HelloOpenCL application are allocated at L3 cache. There are a lot of utilization room for GPU since GPU stays in stalled and idle states in most times. In other words, Intel OpenCL device can take more complex tasks.

See also

https://software.intel.com/articles/getting-started-with-opencl-code-builder

https://software.intel.com/en-us/articles/opencl-drivers

Mouse / Touch Mode Detection on Windows® 10 and Windows* 8

$
0
0

Download Code Samples

This project demonstrates how to detect which mode a 2 in 1 laptop is in (slate vs. clamshell) on Windows* 8(.1) as well as Windows® 10’s new mouse and touch mode. Even though mouse / touch mode is similar in concept to slate / clamshell mode, Windows 10 has a new capability for users to override the mode, while Windows 8 depended only on the physical state of the convertible. Therefore, Windows 10 users are able to use the enhanced GUI designed for touch even if the machine is not a convertible as long as it has a touch screen (such as All-in-One). This new capability is based on the new UWP (Universal Windows Platform) APIs, and you’ll need to add a few lines of code to Windows 8 apps to take advantage of this feature for Windows 10. This white paper shows you how to enable Win32 apps to take advantage of the UWP APIs via WRL (Windows Runtime C++ Template Library) on Windows 10. For enabling UWP apps directly, refer to the sample code from Microsoft.

Requirements

  1. Windows 10
  2. Visual Studio* 2015. The new API doesn’t exist on Visual Studio 2013

Windows 10 Mouse and Touch Mode Overview

  • Manual setting
    • Slide in from the right and the Action Center will show up (known as charm menu on Windows 8).
    • Tap the “Tablet mode” button to toggle between touch and mouse modes.

Tablet mode button to toggle between touch and mouse modes

  • Hardware-assisted setting
    • When the convertible detects physical state changes, it notifies the OS.
    • The OS asks the user to confirm. If the user confirms, the OS will toggle the mode.

If user confirms, the OS will toggle the mode

  • For testing purposes, go to Settings->System->Tablet mode and set the preferences to “Always ask me before switching.”

Sample App

Depending on the OS, the sample application, a dialog-based app, will either:

  • Windows 10 - log the touch / mouse mode event and time, either from the manual settings or automatic switch.
  • Windows 8 - report the physical state change events and the time (slate / clamshell mode.)

Sample Application, a dialog-based app

Just as Windows 8 broadcasts WM_SETTINGCHANGE (lParam == “ConvertibleSlateMode”) message for physical state changes, Windows 10 broadcasts WM_SETTINGCHANGE (lParam == “UserInteractionMode”) to the top-level window. However, it also broadcasts the old message as well. The application needs to detect the OS version and provide a different code path depending on it. Otherwise, it will end up responding to the messages twice on Windows 10.

void CMy2in1LogDlg::OnSettingChange(UINT uFlags, LPCTSTR lpszSection)
{
	CDialogEx::OnSettingChange(uFlags, lpszSection);

	// TODO: Add your message handler code here
	if (lpszSection != NULL)
	{
		CString strMsg = CString(lpszSection);

		if (m_dwVersionMajor < 10 && strMsg == _T("ConvertibleSlateMode"))
		{
			CString strTime;
			GetTime(strTime);
			BOOL bSlate = GetSystemMetrics(SM_CONVERTIBLESLATEMODE) == 0;
			CString strMsg = CString(bSlate ? _T("Slate Mode") : _T("Clamshell Mode"));
			m_ctrlEvents.InsertItem(m_iEvent, strTime);
			m_ctrlEvents.SetItemText(m_iEvent, 1, strMsg);
			m_iEvent++;
			return;
		}

		if (m_dwVersionMajor >= 10 && strMsg == _T("UserInteractionMode"))
		{
			CString strTime, strMsg;
			GetTime(strTime);
			int mode;

			if (GetUserInteractionMode(mode) == S_OK)
			{
				if (mode == UserInteractionMode_Mouse)
					strMsg.Format(_T("Mouse Mode"));
				else if (mode == UserInteractionMode_Touch)
					strMsg.Format(_T("Touch Mode"));
				m_ctrlEvents.InsertItem(m_iEvent, strTime);
				m_ctrlEvents.SetItemText(m_iEvent, 1, strMsg);
				m_iEvent++;
			}
		}
	}
}

Once the application receives the message, it queries the current state because the message only notifies the OS of the mode change, but not what state it is. There is no Win32 API to directly query the new states, but WRL can be used to access Windows RT components from Win32 app as illustrated in the following code snippet.

HRESULT CMy2in1LogDlg::GetUserInteractionMode(int & iMode)
{
	ComPtr<IUIViewSettingsInterop> uiViewSettingsInterop;

	HRESULT hr = GetActivationFactory(
		HStringReference(RuntimeClass_Windows_UI_ViewManagement_UIViewSettings).Get(), &uiViewSettingsInterop);

	if (SUCCEEDED(hr))
	{
		ComPtr<IUIViewSettings> uiViewSettings;
		hr = uiViewSettingsInterop->GetForWindow(this->m_hWnd, IID_PPV_ARGS(&uiViewSettings));
		if (SUCCEEDED(hr))
		{
			UserInteractionMode mode;
			hr = uiViewSettings->get_UserInteractionMode(&mode);
			if (SUCCEEDED(hr))
			{
				switch (mode)
				{
				case UserInteractionMode_Mouse:
					iMode = UserInteractionMode_Mouse;
					break;

				case UserInteractionMode_Touch:
					iMode = UserInteractionMode_Touch;
					break;

				default:

					break;
				}
			}
		}
	}

	return S_OK;
}


Conclusion & Other Possibilities

This sample code shows how to enable 2 in 1 detection on Windows 8/8.1 and Windows 10 using Win32. It was not possible to detect 2 in 1 events on Windows Store Apps on Windows 8. With Windows 10, UWP APIs are provided so that universal apps can take advantage of 2 in 1 capability. Instead of providing a comparable Win32 API, a method to use the UWP API from Win32 app is presented. It may be worthwhile to note that UWP APIs do not have a specific notification for this, but use window resize events, followed by verifying the current state. If the state is different from the saved state, the state has changed. If it is not convenient to use Win32 messages (as in Java* applications), you can use Java’s window resize event and call the JNI wrapper to confirm the state.

License
Intel sample sources are provided to users under the Intel Sample Source Code License Agreement.

Intel® RealSense™ Labs from IDF 2015

$
0
0

IDF 2015 Lab SFTL006 "Creating Best-in-Class Intel® RealSense Applications" is now available for download from the link in this article.

There are 6 labs including Microsoft* Visual Studio* 2013 solutions that cover the Intel RealSense F200 camera for 3D segmentation, various hand usages, face tracking and raw streams. There are also 3 labs for the Intel RealSense R200 camera covering enhanced photography, Scene Perception/AR, and raw streams. A Lab Guide with step by step instructions is also provided. 

Note: The samples were made using the V5 (R3) version of the SDK.

Labs:
Raw Streams - Front and Rear Intel® RealSense Cameras https://software.intel.com/en-us/articles/raw-streams
3D Background Segmentation - Front  Intel® RealSense Camera https://software.intel.com/en-us/articles/3d-segmentation
Face Tracking - Front  Intel® RealSense Camera https://software.intel.com/en-us/articles/face-tracking-lab
Hands Tracking - Front  Intel® RealSense Camera  https://software.intel.com/en-us/articles/realsense-hands-lab
Enhanced Photography - Rear Intel® RealSense Camera    https://software.intel.com/en-us/articles/ep-lab
AR - Scene Perception -   Rear Intel® RealSense Camera     https://software.intel.com/en-us/articles/ar-scene-perception

Intel System Debugger, System Trace – a sample trace to evaluate basics

$
0
0

Introduction

Instead of setuping a system from beginning and capturing the trace file by yourself, you can find a sample trace file and one-page illustration pdf guide inside the attached file of this article. This can enable you to evaluate this system trace viewer functionalities immediately. Check the attached zip file. You can access another article to know the system setup for how to validate system trace feature provided by Intel System Debugger. 

Viewing all 533 articles
Browse latest View live


<script src="https://jsc.adskeeper.com/r/s/rssing.com.1596347.js" async> </script>